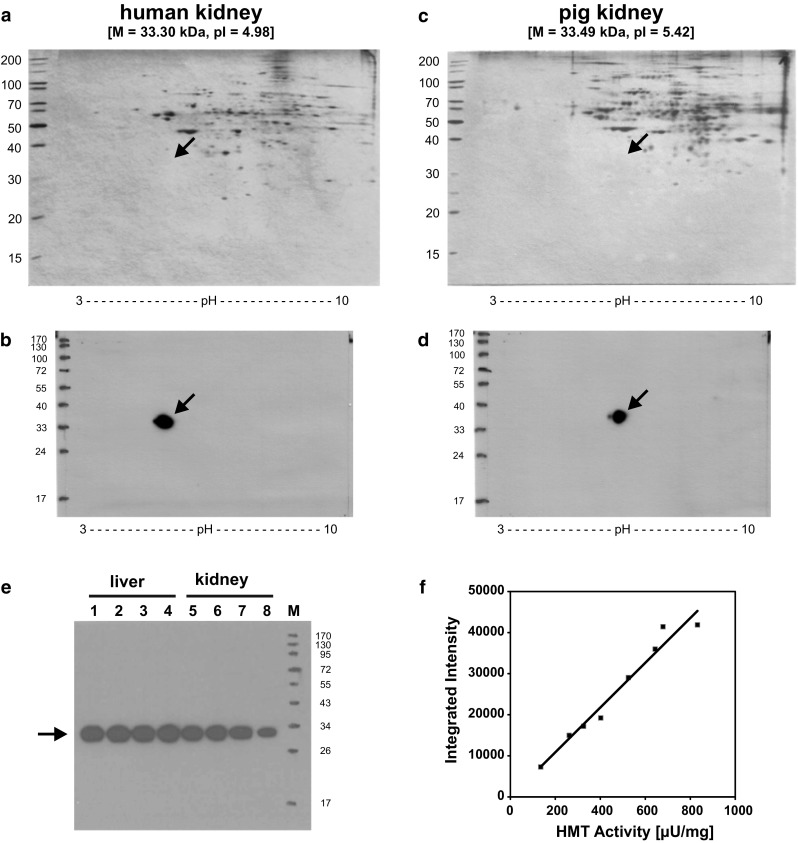
Fig. 3.

Detection of HMT on 2D-IEF/SDS-PAGE gels and correlation of band intensity with HMT activity. Ten microgram each of a human kidney homogenate (a, b) or a porcine kidney homogenate (c, d) was separated by isoelectric focusing on a pH 3–10 gradient IEF gel followed by size separation on a 10 % SDS polyacrylamide gel. Gels were either silver-stained (a, c) or blotted onto PVDF membranes (b, d). For detection of HMT, blots were incubated with HYB372-07 (1:6000 in TBSTM) and horseradish peroxidase-conjugated anti-mouse immunoglobulins (1:1500 in TBSTM), followed by ECL prime substrate, and exposure to film for 1 min. The molecular mass and pI values calculated for the human and porcine HMT proteins are given in square brackets on top of the gels. e 2 µg each of four different human liver homogenates (lanes 1–4) and four different human kidney homogenates (lanes 5–8) were separated on a 10 % SDS polyacrylamide gel, blotted onto PVDF membrane, and HMT was detected by incubation with HYB372-05 (1:6000 in TBSTM) and horseradish peroxidase-conjugated anti-mouse immunoglobulins (1:1500 in TBSTM), followed by ECL prime substrate, and exposure to film for 1 min. f Integrated intensity determined for the bands on the blot in (e) using ImageJ was plotted against the HMT activity in the respective sample. A Pearson’s correlation coefficient of 0.983 with p < 0.01 was obtained for this correlation using SPSS Statistics 19 (SPSS Inc., Chicago, USA). Sizes of molecular weight markers (M) are given in kilodalton and the migration position of HMT at ca. 33 kDa is indicated by arrows
