
Fig. 3.
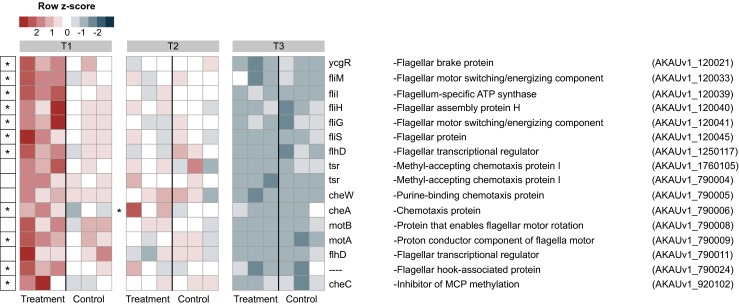
Heat map showing the expression patterns of chemotaxis and flagellar motility related genes. The data refer to genes in the control (B. terrae BS001) and treatment (B. terrae BS001 + Lyophyllum sp. strain Karsten) at time points T1 (day 3), T2 (day 5) and T3 (day 8). *Statistical significance (statistical analysis was performed using DESeq: P < 0.05) between control and treatment. The heat map was constructed based on normalized read counts. The standardized normalized read count, denoted as the row Z-score, is plotted in color scale (red indicates higher expression and blue indicates lower expression). The putative products are given in front of each gene with their respective locus tags