
Fig. 4.
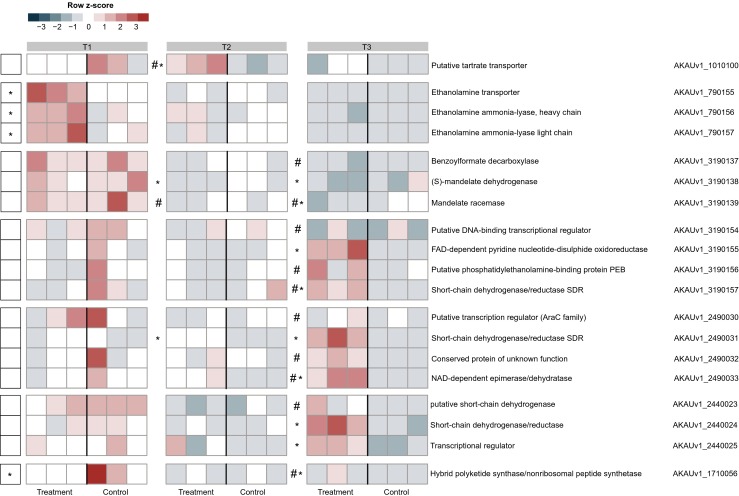
Heat map showing the expression patterns of gene clusters involved in diverse metabolic and energy generation pathways. The data refer to genes in the control (B. terrae BS001) and treatment (B. terrae BS001 + Lyophyllum sp. strain Karsten) at time points T1 (day 3), T2 (day 5), and T3 (day 8). *Statistical significance (statistical analysis was performed using DESeq; P < 0.05) between control and treatment. The heat map was constructed based on normalized read counts. The standardized normalized read count, denoted as the row Z-score, is plotted in color scale (red indicates higher expression and blue indicates lower expression). The putative products are given in front of each gene with their respective locus tags. #Genes with low read counts (see the “Materials and Methods” section)