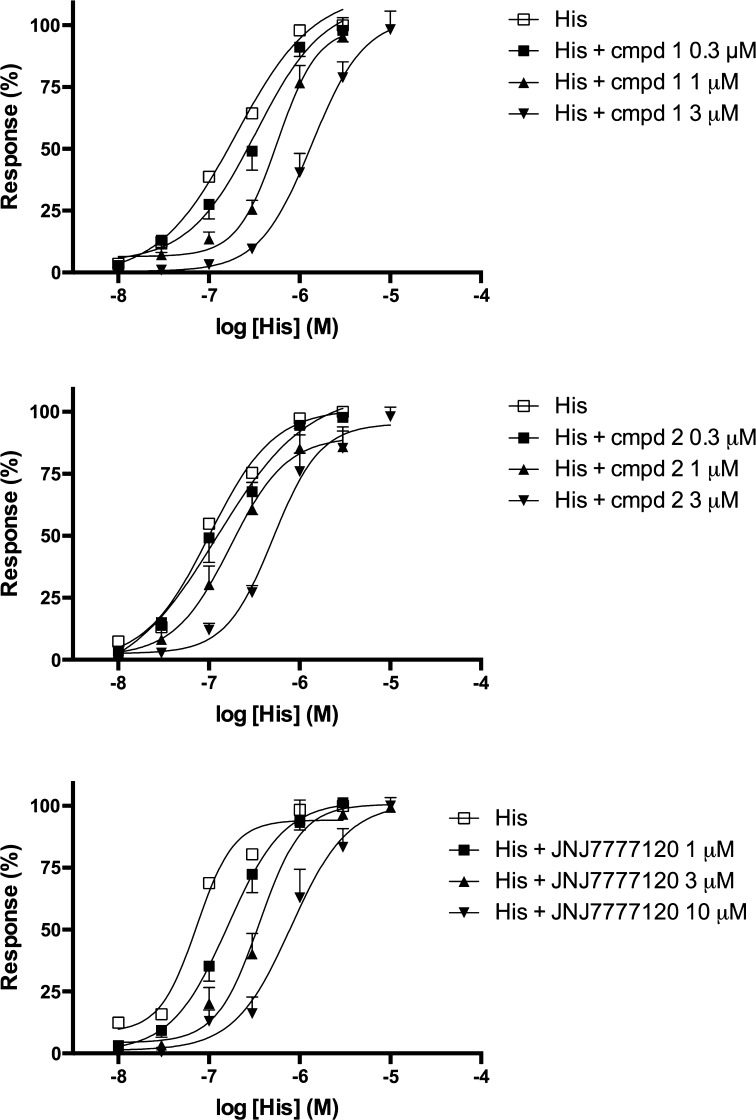
Fig. 8.
Effect of tested compounds (1 and 2) and antazoline on H1 histamine receptors. Concentration-response curves to histamine (His) in the absence or presence of increasing concentrations of compounds. Results are expressed as percentage of the maximal response to histamine in the corresponding concentration-response curve. Each point represents the mean ± SEM (n = 6–8)

