Figure 1.

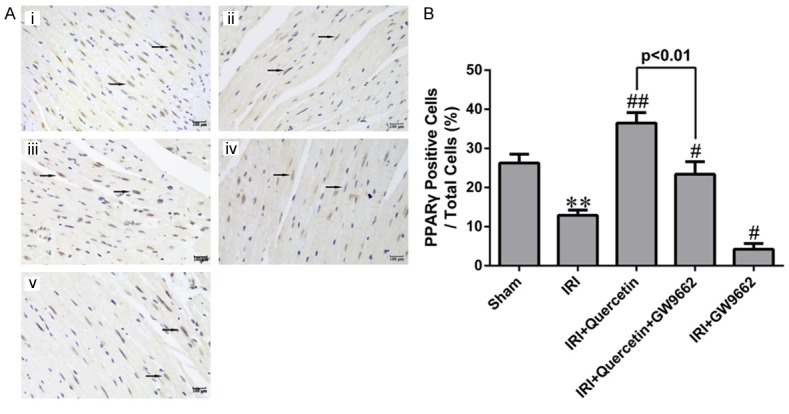
The expression of PPARγ in myocardial IRI mice in vivo. A. Representative images of IHC analysis of PPARγ expression in mouse myocardial sections of different groups. (i) Sham-operated mice treated with vehicles (Sham). (ii) Myocardial IRI mice treated with vehicles (IRI). (iii) Myocardial IRI mice treated with quercetin (IRI+Quercetin). (iv) Myocardial IRI mice treated with GW9662 and quercetin (IRI+Quercetin+GW9662). (v) Myocardial IRI mice treated with GW9662 (IRI+GW9662). PPARγ-positive nuclei are indicated by arrows (magnification 400×). B. Quantification of PPARγ-positive cells (black arrows in photograph A) in different groups (five fields for each specimen). Data were expressed as mean ± standard deviation (SD). **P<0.01 vs Sham group; #P<0.05, ##P<0.01 vs IRI group. All experiments were repeated six times.
