
Figure 1.
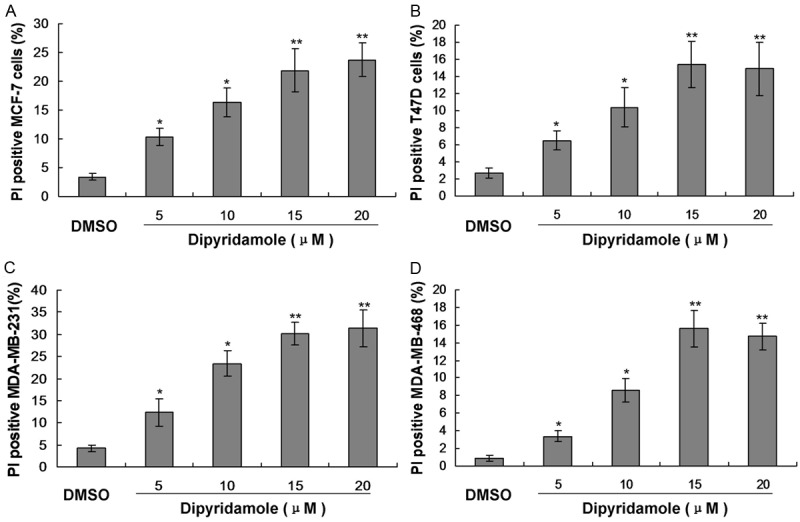
Observation for the cell cytotoxicity induced by the treatment of dipyridamole (5, 10, 15 and 20 μM) by using the FACS analysis in breast cancer cells. A. Cytotoxicity in MCF-7 cells. B. Cytotoxicity in T47D cells. C. Cytotoxicity in MDA-MB-231 cells. D. Cytotoxicity in MDA-MB-468 cells. *P<0.05 and **P<0.01 represent the percentage of PI positive cells in dipyridamole treated group compared to the DMSO control group.