
Figure 4.
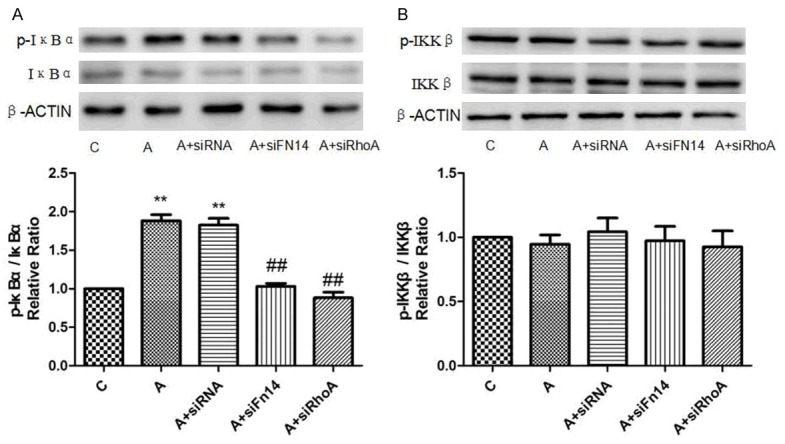
Effect of Fn14 and RhoA knock-down on phosphorylation of IκBα and IKKβ induced by Ang II in cardiomyocytes. A. Relative protein expression levels of active and total IκBα are normalised to β-actin and expressed as the mean ± SEM, n = 3. **p < 0.01 vs. C group, ##p < 0.01 vs. Ang II group. B. Relative protein expression levels of active and total IKKβ are normalised to β-actin and expressed as the mean ± SEM, n = 3.