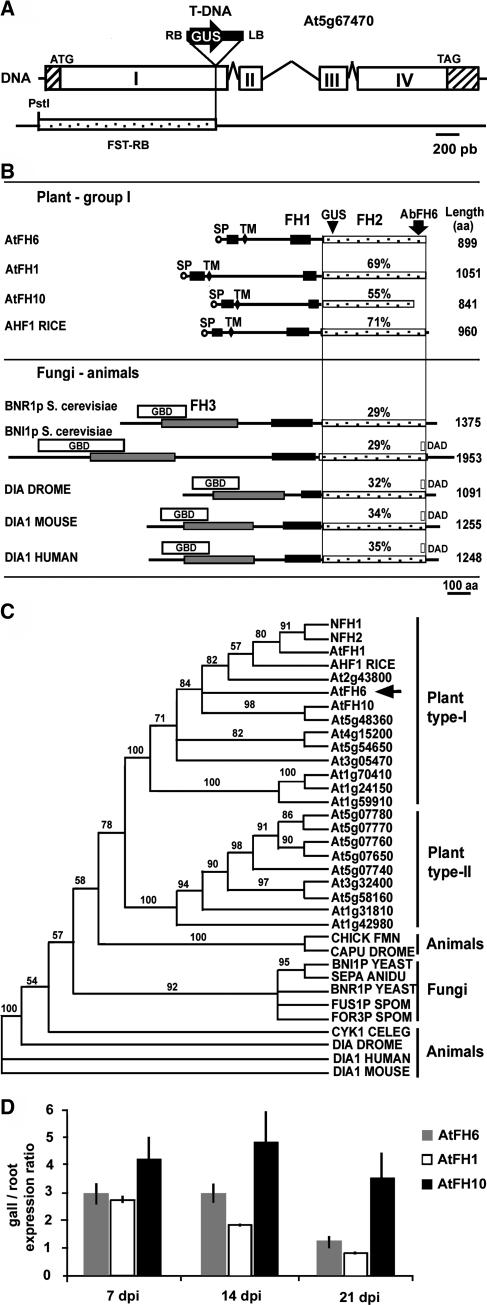
Figure 2.
The AtFH6 Gene Encodes an FH Protein.
(A) Organization of the AtFH6 gene and molecular analysis of the T-DNA insertion. Open boxes are the exons (I to IV, determined from cDNA), and the sequences between these boxes correspond to introns; hatched boxes indicate untranslated sequences. The T-DNA is inserted into the first exon. RB and LB correspond to the right and left T-DNA borders, respectively, and GUS the coding region of the β-glucuronidase gene. The initiation and stop codons are indicated. The RB flanking sequence (FST-RB) obtained by kanamycin rescue is shown.
(B) Schematic representation of AtFH6 and other FH-related proteins. All members share a central Pro-rich domain, FH1 (black boxes), and the FH2 domain (stippled boxes). The site of GUS fusion in the CSQ2 line is indicated. A second Pro-rich domain (black boxes) between a signal peptide (SP, circles) and a transmembrane segment (TM, lozenges) was observed only in plant type-I FH proteins. The GBD (white boxes), DAD (white boxes), and FH3 domains (gray boxes) are present in non-plant FH proteins. The percentage of similarity of sequences to the AtFH6 FH2 domain is indicated. Comparisons were made between three plant type-I FHs—Arabidopsis AtFH1 (Banno and Chua, 2000) and AtFH10 and rice AHF1—and five fungal and animal FH proteins—S. cerevisiae BNI1p and BNR1p (Evangelista et al., 1997; Imamura et al., 1997), Drosophila Dia (Dia Drome) (Castrillon and Wasserman, 1994), mouse DIA1 (Watanabe et al., 1997), and human DIA1 (Lynch et al., 1997).
(C) Neighbor-joining dendrogram of relationships among plant, yeast, and animal FH2 domains. The phylogenetic tree is based on the Clustal alignment of the FH2 domains of Arabidopsis FH proteins, rice AHF1, tobacco NFH1 and NFH2 (Banno and Chua, 2000)—and five fungal and six animal FH proteins—BNI1p, BNR1p, S. pombe FUS1p and FOR3p, Aspergillus nidulans SEPA, chicken FMN, Drosophila DIA and CAPPUCCINO (CAPU), mouse and human DIA1, and Caenorhabditis elegans CYK1. Bootstrap support (data resampled 100 times) for the apparent groupings is indicated.
(D) Quantitative RT-PCR analysis of the transcript abundance of AtFH6, AtFH1, and AtFH10 in galls 7, 14, and 21 dpi compared with noninfected root tissues.

