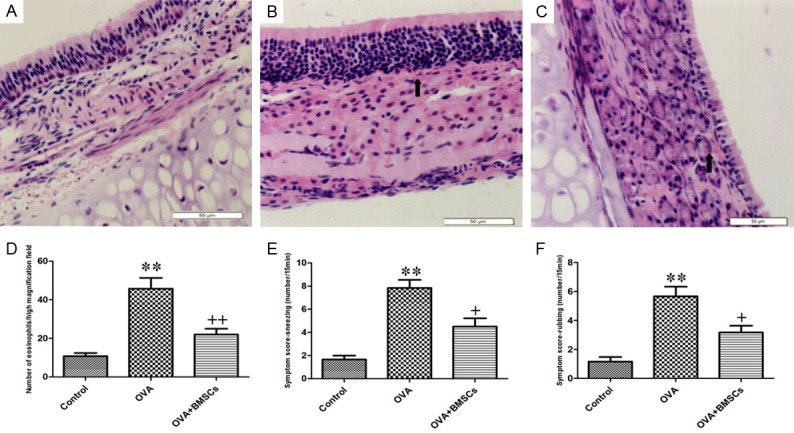
Figure 3.

Comparison of nasal mucosa histopathology, eosinophilic infiltration and nasal symptoms among three groups. A. Control group. B. OVA group. C. OVA+BMSCs group. D. Eosinophil counts in the nasal mucosa. E. Sneezing. F. Nasal rubbing. *P < 0.05; **P < 0.01 vs control group. +P < 0.05; ++P < 0.01 vs OVA group.
