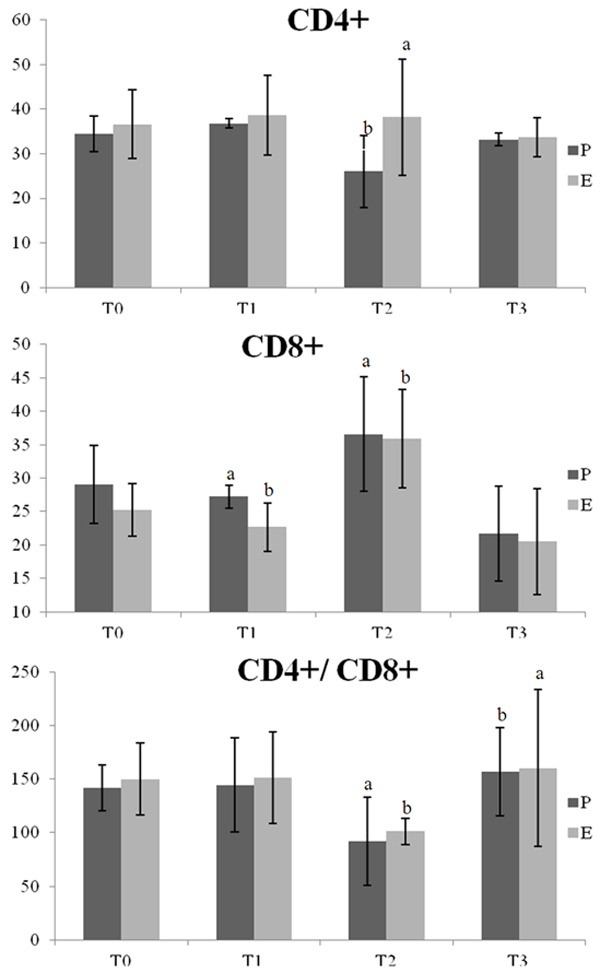
Figure 2.

CD4+ (%), CD8+ (%) and CD4+/CD8+ group P and group E patients at various time points. In-group comparisons: Two T2 CD4+ patients exhibited a significant decrease in CD4+ (P < 0.05) compared with T0, and CD8+ increased at T0 (P < 0.05). No significant differences in T1 and T3 were observed compared with T0. Between the two groups: The T2 CD4+ percentage was higher in group E compared with group P (P < 0.05). The percentage of CD8+ cells at T1 was lower in group E compared with group P (P < 0.05). The differences in the remaining points were not statistically significant.
