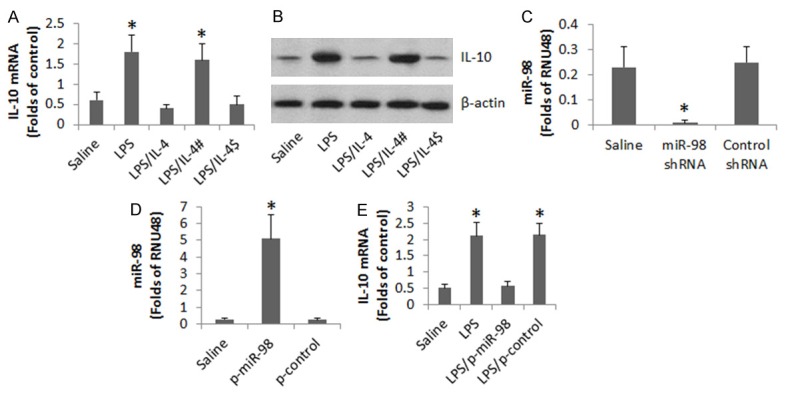
Figure 4.

Assessment of the role of miR-98 in the IL-4-suppressed IL-10 expression in B cells. Peripheral B cells were collected from 3 healthy subjects. The B cells were treated in the culture as denoted on the X axis of (A). LPS = 500 ng/ml. IL-4 = 200 pg/ml. #, miR-98-deficient B cells. $, B cells were treated with control shRNA. (A) The bars indicate the levels of IL-10 mRNA in the B cells. (B) The immune blots indicate the protein levels of IL-10 in the B cells. (C) The bars indicate the miR-98 RNAi results. (D) The bars indicate the results of overexpression of miR-98 in B cells. p-miR-98: miR-98 plasmids. p-control: Control plasmids. (E) The bars indicate the mRNA levels of IL-10 in B cells. Data of bars are presented as mean ± SD. *, P<0.01, compared with the saline group. The data are representatives of 3 independent experiments.
