Fig. 5.
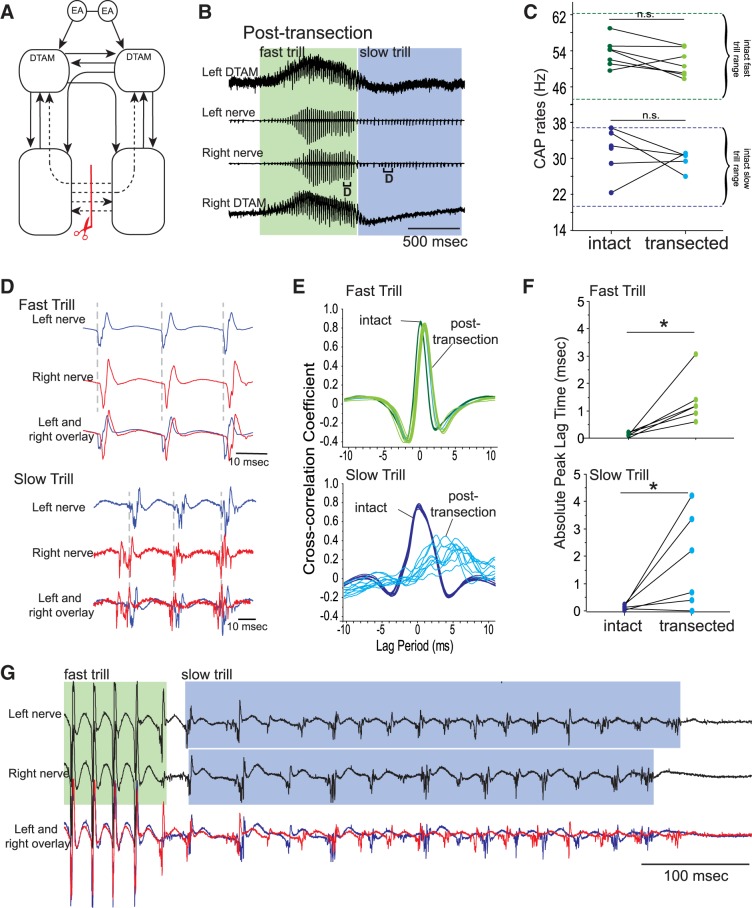
Effects of sagitally transecting the posterior commissure alone on fictive advertisement calls. A: diagram of the vocal pathways showing the transection in red line with scissors, transected projections in dotted arrows, and intact projections in solid arrows. B: example of the bilateral DTAM LFP (top and bottom) and laryngeal nerve recordings (middle 2) obtained during fictive advertisement call after posterior commissure sagittal transection. Green and blue frames indicate fast and slow trills, respectively, for all figures. Brackets with D are enlarged in D. C: mean fast and slow trill rates before and after transection from 6 brains. Each pair of points indicates mean rate before and after transection in 1 animal. Pairs of dotted green and blue lines indicate the range of fast and slow trill rates obtained from intact brains. D: enlarged sections of brackets labeled in B. Left (blue) and right (red) nerve recordings are shown during fast and slow trills with the overlay of the nerve activities at the bottom. E: example of cross-correlation between the left and right nerve recordings for fast and slow trills before and after transection. F: absolute peak lag time before and after the transection, plotted for each animal as in C. *P < 0.05, significant differences. G: example of the left and right nerve recordings during a fictive fast and slow trill. In this recording, left and right CAPs are largely asynchronous only during the slow trill.

