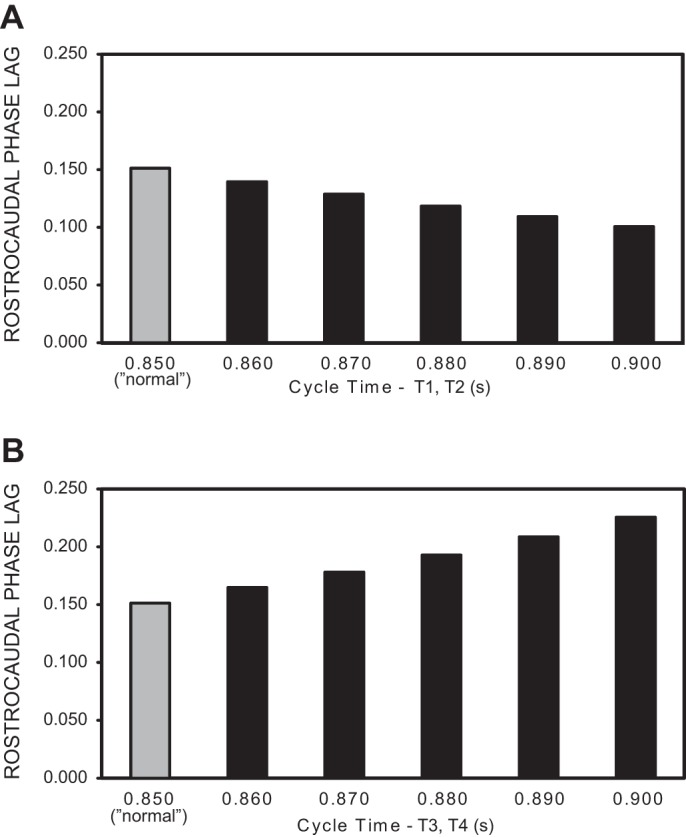
Fig. 11.

Rostrocaudal phase lags of rhythmic “locomotor” output waveforms generated by the computer models in Fig. 10. Shaded bars are phase lags for model representing “normal” animals, with the same drive to rostral and caudal oscillators (T1–T4 = 0.85 s; see Fig. 5B and methods). A: rostrocaudal phase lags vs. drive to rostral oscillators from RS neurons (see Fig. 10A2), with normal coupling between ipsilateral oscillators (see Fig. 10C). The intrinsic cycle times of the caudal oscillators were T3 = T4 = 0.85 s, and the x-axis values indicate the intrinsic cycle times of rostral oscillators (T1, T2). B: rostrocaudal phase lags vs. drive to caudal oscillators from PS neurons (see Fig. 10A2), with normal coupling between ipsilateral oscillators (see Fig. 10D). The intrinsic cycle times of the rostral oscillators were T1 = T2 = 0.85 s, and the x-axis values indicate the intrinsic cycle times of caudal oscillators (T3, T4).
