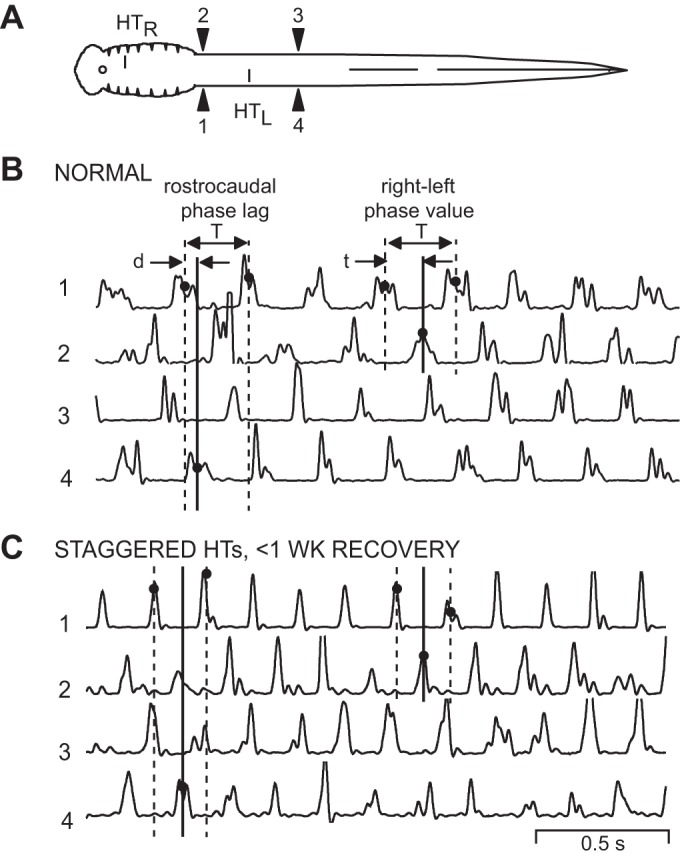
Fig. 2.

Muscle burst activity in normal animals and in animals following acute staggered right-left spinal HTs. A: diagram of a lamprey showing muscle recording electrodes at 20% BL (1, 2) and 40% BL (3, 4). Staggered right-left spinal HTs at 10% and 30% BL (HTR, HTL) are applicable for the recording in C only (see methods). B: in a normal animal, sensory stimulation of the oral hood elicited swimming muscle burst activity (integrated; see methods) consisting of left-right alternation (1↔2, 3↔4) and rostrocaudal phase lags (1→4, 2→3). The vertical lines at left indicate the cycle time (T) and the delay (d) between ipsilateral burst activity (solid line; 1→4). This delay and cycle time were used to calculate rostrocaudal phase lags on the left side (Φ1→4; see methods). The vertical lines at right indicate the cycle time (T) and the delay (t) between contralateral burst activity (solid line; 1→2). This delay divided by cycle time (t/T) was used to calculate rostral right-left phase values (Φ2-1; see methods). C: in an animal 3 days after it received staggered right-left spinal HTs, relatively normal muscle burst activity occurred during swimming. The 3 vertical lines at left indicate a larger rostrocaudal phase lag compared with those in normal animals (see B), whereas the 3 vertical lines at right indicate that right-left phase values were similar to those in normal animals.
