
Fig. 4.
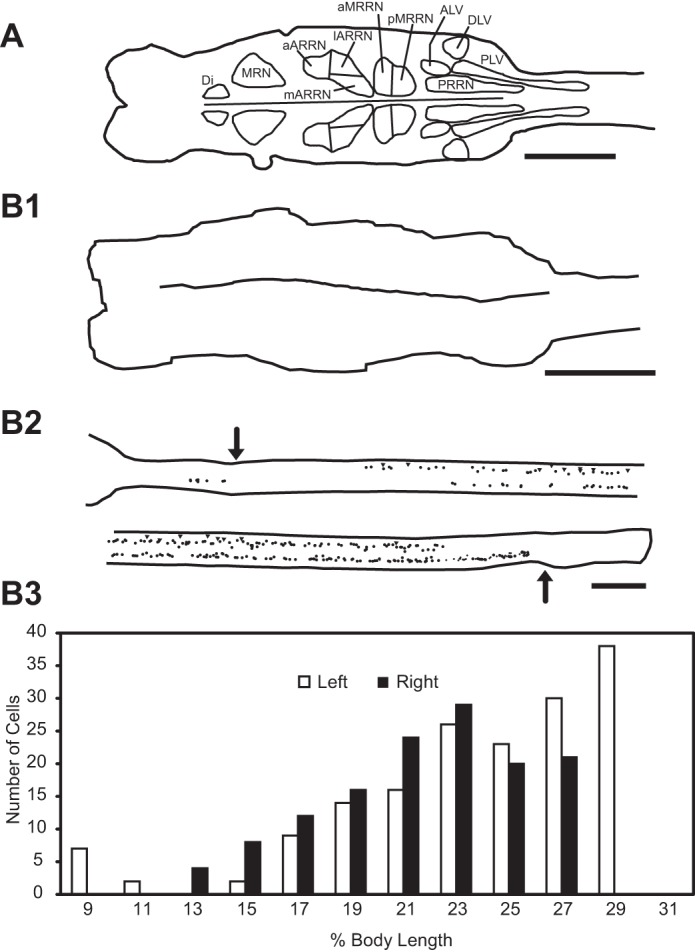
A: diagram of larval lamprey brain (left) and rostral spinal cord (right) showing contours around different groups of descending brain neurons (Davis and McClellan 1994): reticular nuclei, including mesencephalic reticular nucleus (MRN) and anterior (ARRN), middle (MRRN), and posterior rhombencephalic reticular nuclei (PRRN); and nonreticular cell groups, including diencephalic (Di), anteriolateral vagal (ALV), dorsolateral vagal (DLV), and posteriolateral vagal (PLV) groups. B: experimental animal in which HRP was applied to the spinal cord at 40% BL at 7 days (acute animal group) following staggered right-left spinal HTs. B1: brain showing no labeling of descending brain neurons. B2: spinal cord (∼8–32% BL; rostral is upper left) showing labeled descending PS neurons (dots) and sites of staggered HTs (arrows). B3: histogram showing distribution of these neurons vs. percent body length (histogram bins = 2% BL ≈ 2 mm). Scale bars, 1 mm.