
Fig. 5.
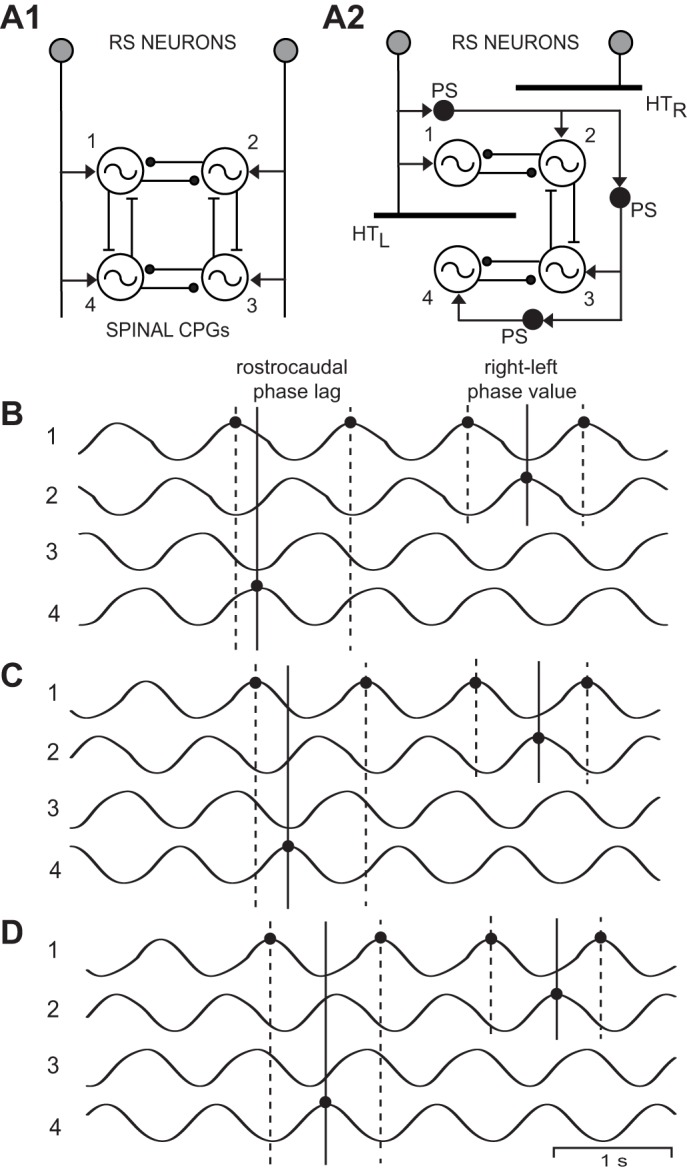
A1: diagram of computer model representing “normal” animals and showing RS neurons directly activating rostral (1, 2) and caudal (3, 4) left-right pairs of spinal oscillators that were connected by reciprocal inhibition (solid line ending in filled circle). Ipsilateral oscillators were connected by asymmetrical reciprocal excitation (solid line ending in crossbar) that was stronger in the descending direction than the ascending direction (Hagevik and McClellan 1994; McClellan and Hagevik 1999). A2: model incorporating acute staggered right-left spinal HTs (HTR and HTL, thick horizontal bars) in which coupling between the 1 and 4 oscillators was removed (for waveforms in C and D only). B: rhythmic “locomotor” output waveforms generated by a model (A1) representing “normal” animals (T1–T4 = 0.85 s) consisting of left-right alternation (1↔2, 3↔4) and rostrocaudal phase lags (1→4, 2→3). C: “locomotor” output waveforms from a model (A2) incorporating staggered right-left spinal HTs in which 1–4 coupling was removed, but without a cycle time gradient (T1–T4 = 0.85 s; see methods). D: “locomotor” output waveforms from a model (A2) incorporating staggered right-left spinal HTs in the absence of 1–4 coupling and with a cycle time gradient (T1 = 0.85 s; T2 = 0.87 s; T3 = 0.89 s; and T4 = 0.91 s; see methods). In B–D, the 3 vertical lines at left indicate the rostrocaudal phase lag on the left side (Φ1→4), whereas the 3 vertical lines at right indicate the rostral right-left phase value (Φ2-1; see legend for Fig. 2). Note that in D, the left rostrocaudal phase lags and, to a lesser extent, rostral right-left phase values were further increased compared with those in C.