Fig. 1.
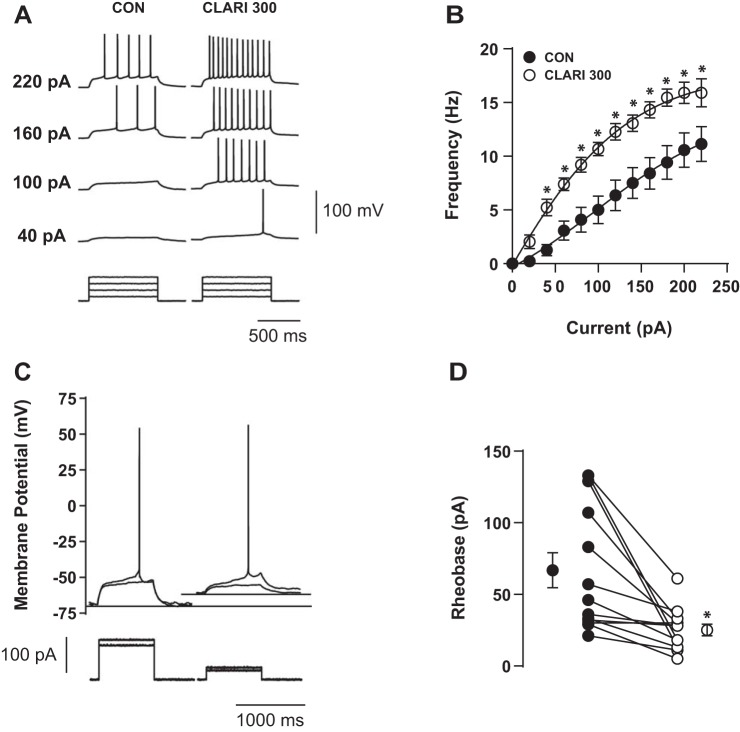
Clarithromycin induced hyperexcitability in CA3 region of hippocampus. A: characteristic voltage responses to increasing current injections (bottom) recorded in a representative neuron in control bath solution (CON; left) and after 5-min acute application of 300 μM clarithromycin (CLARI 300; right). To block glutamatergic synaptic inputs, AMPA/kainate and NMDA receptor antagonists CNQX (10 μM) and d-AP5 (50 μM) were applied in both situations. B: short-term bath exposure to 300 μM clarithromycin significantly enhanced firing frequency and shifted the F-I curve to the left compared with controls (CON) (n = 11, 2-way repeated-measures ANOVA, *P < 0.0001). Each symbol represents mean ± SE. C: characteristic single action potential response (top) to minimum current injection (bottom) from the neuron in A. Rheobase current was reduced by half in the presence of 300 μM clarithromycin (right). Thin horizontal lines illustrate levels of resting membrane potential (VRest). In this example, clarithromycin administration depolarized VRest ∼5 mV compared with baseline (−65 mV). D: lines indicate paired measurements in the same neuron in controls (●) and washed in clarithromycin ACSF (○). In 13 tested cells, 5- to 10-min exposure to antibiotic+ACSF significantly decreased rheobase current vs. controls (CON: 66.8 ± 12.2 pA, CLARI 300: 25.1 ± 4.1 pA; paired t-test, *P = 0.003). Symbols on left and right represent average values ± SE.

