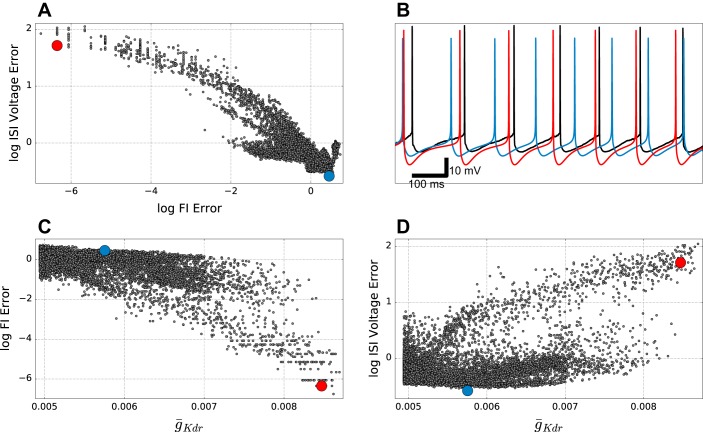
Fig. 3.
Tradeoffs between firing rate (F–I) and interspike-interval (ISI) voltage errors in detailed model archive. A: F–I and ISI voltage error show inverse relationship. B: somatic membrane potential in response to 0.3-nA current clamp corresponding to red and blue points in other panels. Black trace is experimental data. C: F–I error decreases with increasing ḡKdr (r = −0.68; P < 0.001). D: subthreshold ISI Voltage error increases with ḡKdr (r = 0.54; P < 0.001).

