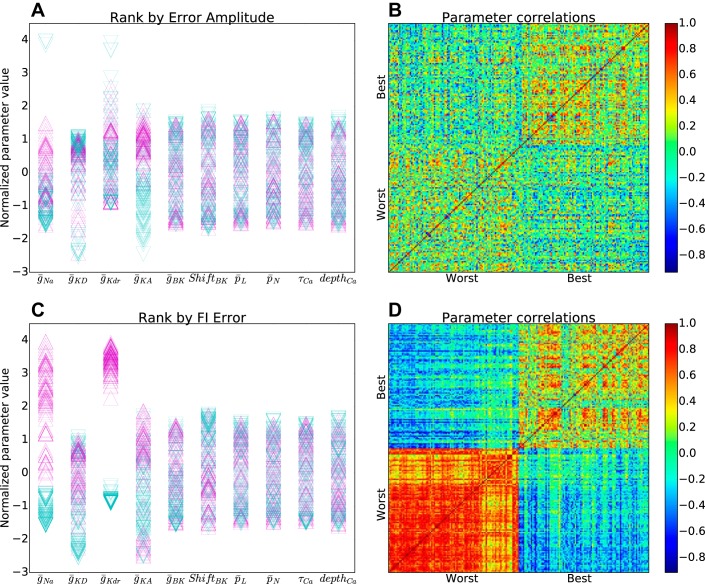
Fig. 4.
Distinct parameter values for top and bottom one percentile in detailed models archive. A: normalized parameter values for top (purple-up triangles) and bottom (blue-down triangles) based on overall fitness across all measures. B: Pearson correlations between parameter vectors in A show weak intraclass similarity (best-best: 0.18; worst-worst: 0.11; best-worst: −0.05). C: normalized parameter values for top (purple-up triangles) and bottom (blue-down triangles) based on F–I fitness. D: Pearson correlations between parameter vectors in C show strong intraclass similarity with strong interclass dissimilarity (best-best: 0.56; worst-worst: 0.86; best-worst: −0.62). (Parameter normalization by subtraction of mean and division by SD.)

