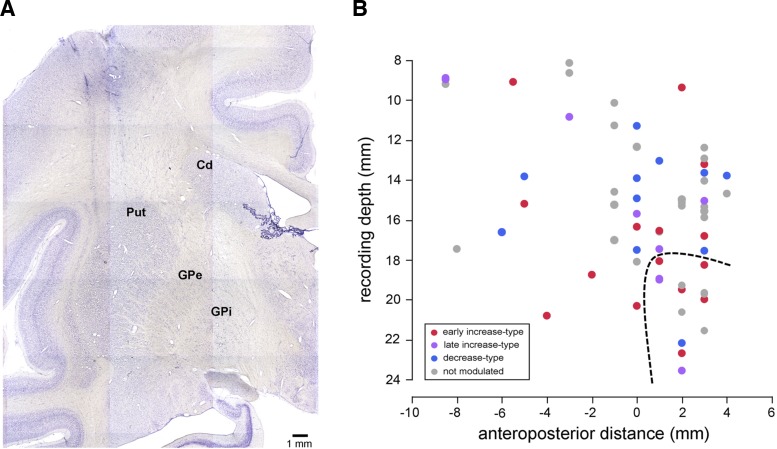
Fig. 8.
Recording positions of FSIs. A: coronal section stained with cresyl violet at the level of the striatum, showing traces of electrode paths above the putamen. B: sagittal view of positions of recorded neurons plotted along the reconstructed electrode penetrations. Each dot corresponds to the position of a single FSI. For each neuron, the anteroposterior location (zero indicates the approximate level of the anterior commissure) is plotted against the depth of the electrode at which it was recorded. The recording depth was measured from a zero reference point as determined by using microdrive depth readings. Colored and gray dots indicate neurons that were or were not modulated during movement, respectively. The dashed line indicates the approximate boundary between dorsal and ventral striatum. Cd, caudate nucleus; Put, putamen; GPe, globus pallidus external segment; GPi, globus pallidus internal segment.

