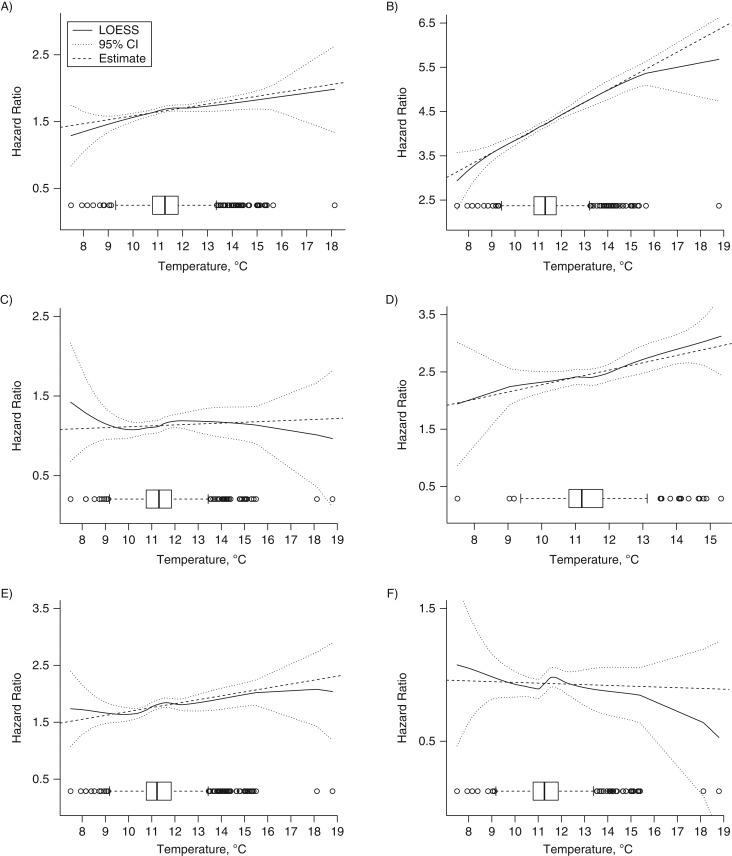
Figure 2.
Level of exposure to temperature and the hazard ratio for the composite diagnosis of metabolic syndrome and each individual component according to level of exposure to fine particulate matter (box-and-whisker plots) among Normative Aging Study participants, 2000–2011. A) Abdominal obesity; B) high fasting blood glucose; C) low high-density lipoprotein cholesterol; D) hypertension; E) hypertriglyceridemia; F) metabolic syndrome. CI, confidence interval; LOESS, locally weighted scatterplot smoothing.

