Figure 1.
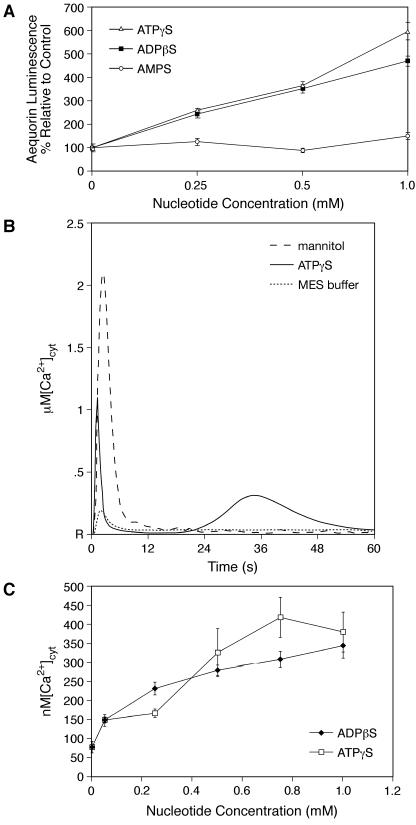
Apoaequorin Transgenic Arabidopsis Respond to Nucleoside Triphosphates and Diphosphates by Increasing the [Ca2+]cyt.
(A) ATPγS and ADPβS induce a dose-dependent increase in aequorin luminescence relative to the control (P < 0.001). Total seedling numbers exceed 130 with a minimum of 8 seedlings/treatment group. Error bars indicate ±se.
(B) Average [Ca2+]cyt peak heights (6 to 10 seedlings/treatment group) plotted over a 1-min time course. Representative traces induced by 500 μM ATP, 50 mM Mes (buffer only), and 0.666 M mannitol. R indicates resting calcium levels.
(C) ATPγS and ADPβS induce a dose-dependent and saturable increase in [Ca2+]cyt peak-2 heights (P < 0.001). Seedling numbers range from 6 to 12 per treatment group.

