FIGURE 2.
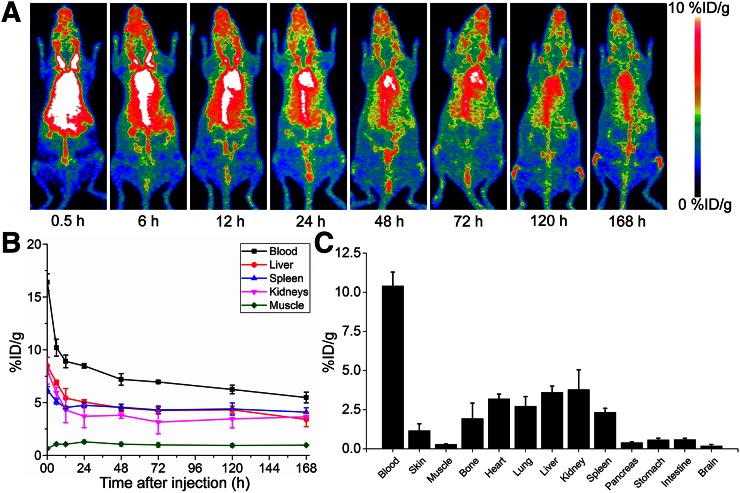
Whole-body PET imaging, quantitative PET analysis, and biodistribution of 89Zr-Df-pembrolizumab in ICR mice. (A) Maximum-intensity projections are shown after injection, with scale ranging from 0 to 10 %ID/g. (B) PET ROI analysis is shown as time–activity curves of blood, liver, spleen, kidneys, and muscle after intravenous injection of 89Zr-Df-pemrolizumab (n = 4). (C) Biodistribution of 89Zr-Df-emrolizumab in blood, organs, and tissues of mice at 168 h after injection (n = 4).

