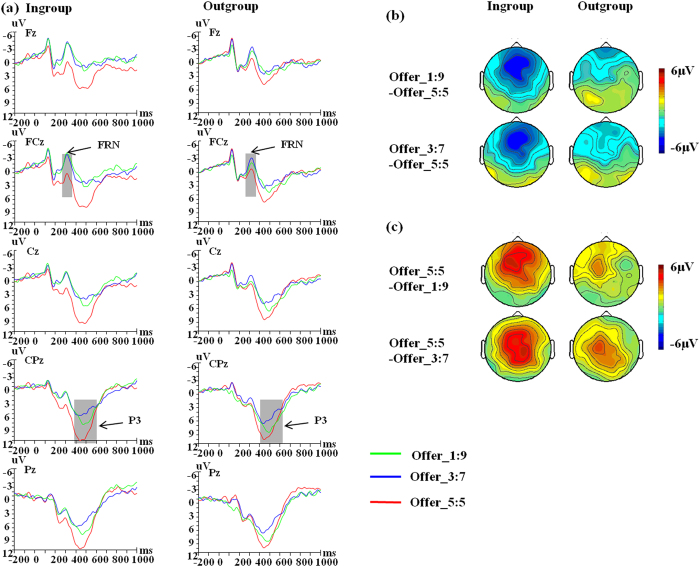
Figure 2. ERP responses and topograhic maps.
(a) ERP responses time-locked to the onset of different offers at the midline Fz, FCz, Cz, CPz and Pz. The shaded 250–350, 400–600 ms time window was used for the calculation of the peak amplitudes of the FRN and P3 respectively. (b) Topographic maps for the FRN effects in the 250–350 ms time window. (c) Topographic maps for the P3 effects in the 400–600 ms time window.

