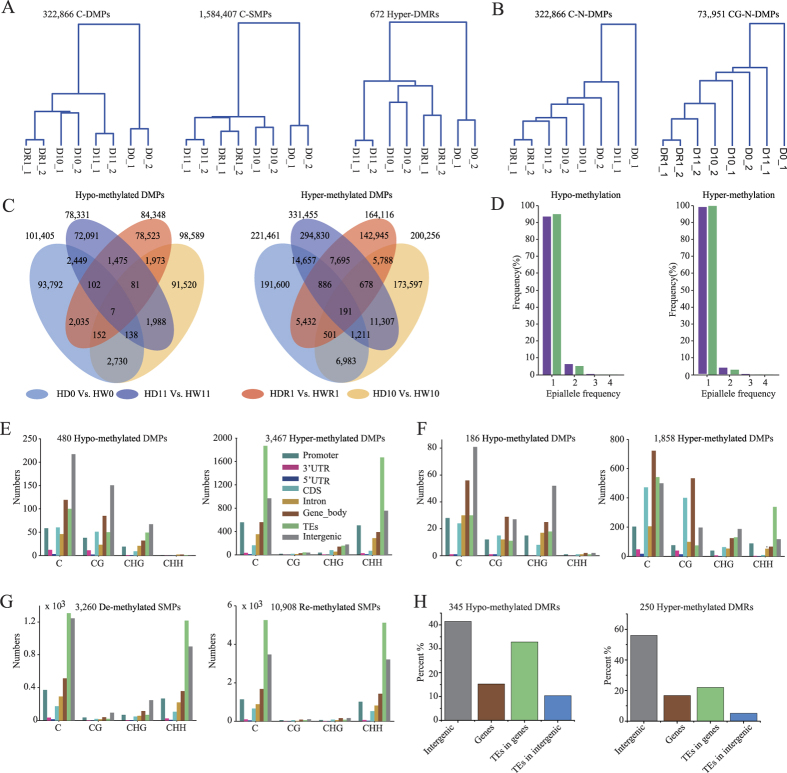
Figure 2. Non-random appearance of drought-induced epimutations.
(A) Hierarchical clusters according to epimutations that would be induced by drought stress, i.e., epimutations between D0 and W0. (B) Hierarchical clusters according to an arbitrary selection of non-epimutation cytosine residues. (C) Epimutations between the drought-treated and well-watered Huhan3 plants of four generations in Huhan3. (D) The proportions of recurring epimutations with different frequencies. The distribution of drought-induced DMPs whose recurrence frequencies are equal to or greater than three on genic regions in Huhan3 (E) and II-32B (F). (G) Distribution of drought-induced DMRs whose recurrence frequencies are equal to or greater than two times on genic regions in Huhan3.

