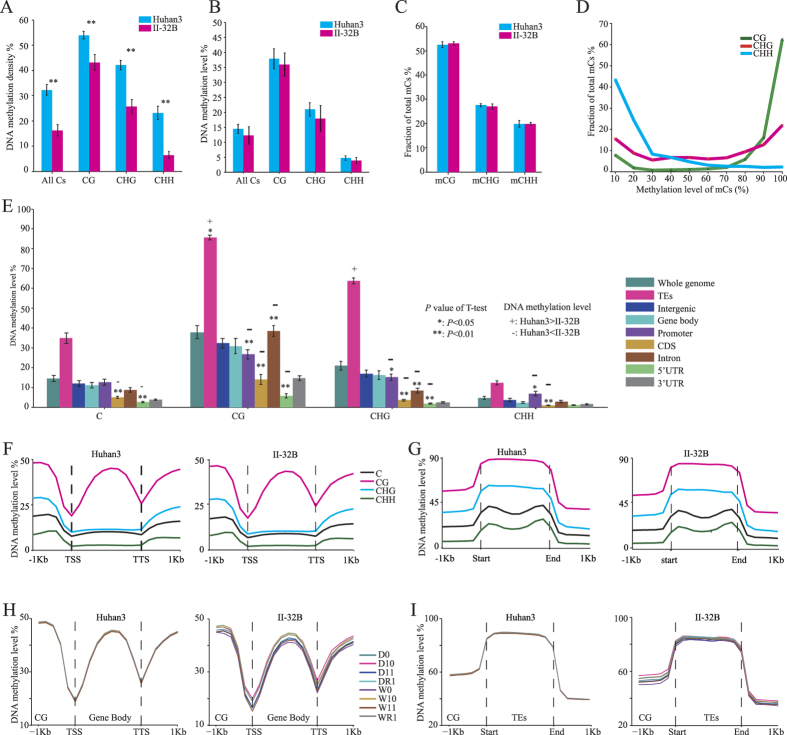
Figure 5. DNA methylation patterns of both rice varieties.
(A) DNA methylation densities for all contexts. (B) DNA methylation levels for all contexts. (C) The relative proportions of mCs in three sequence contexts. (D) Distribution of methylation level for mCs in each sequence context. (E) DNA methylation levels in each sequence context for different genomic regions. Significant differences between Huhan3 and II-32B were determined using t-tests. (F) Distribution of DNA methylation levels in the gene bodies and 1-kb flanking sequences. (G) Distribution of methylation levels in TEs and 1-kb flanking sequences. (H) Distribution of CG DNA methylation levels in gene bodies of each strain. (I) Distribution of CG DNA methylation levels in TEs of each strain.

