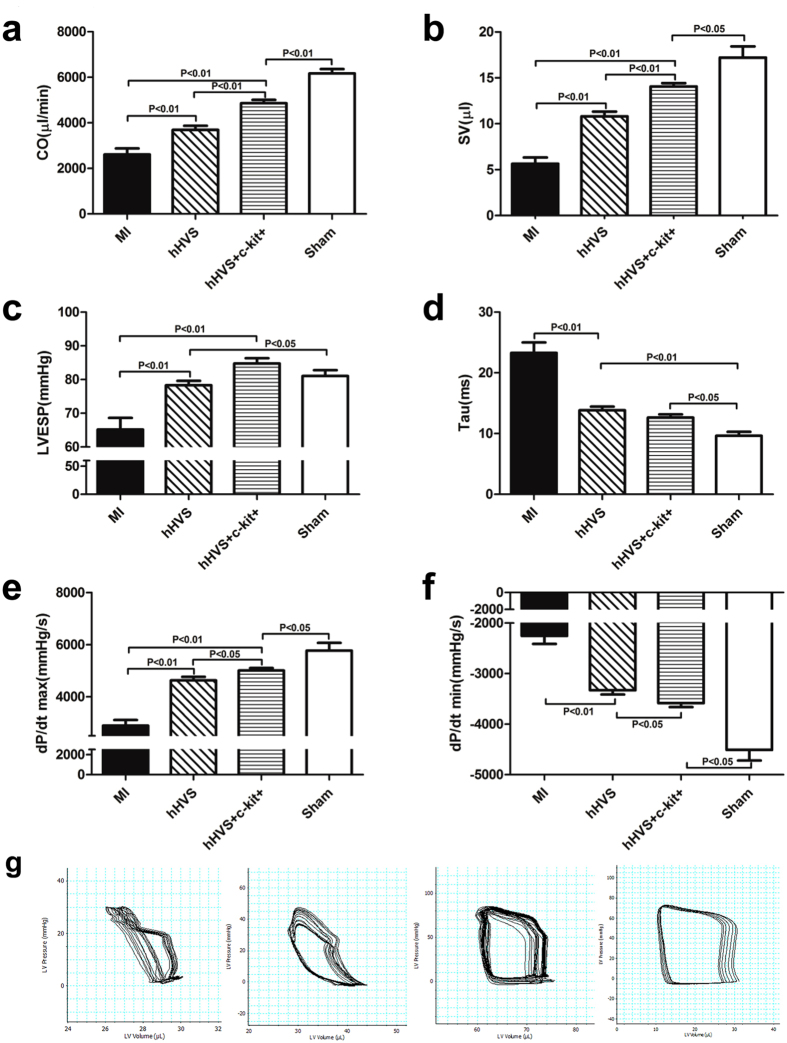
Figure 6. Hemodynamic measurements via a Millar pressure-volume catheter.
(a–f) Calculated haemodynamic parameters shown as indices of pump function (cardiac output, CO; stroke volume, SV), systolic function (LV end-systolic pressure, LVESP; maximal peak rate of LV pressure, dP/dt max) and diastolic function (minimal peak rate of LV pressure, dP/dt min; relaxation time constant, Tau) in MI (without patch implantation), hHVS (MI with implantation of hHVS alone), hHVS + c-kit+ (MI with implantation of c-kit+ cell-seeded hHVS), and sham groups. (g) Pressure and volume signals were combined to construct the representative pressure–volume loops showing the pressure volume relationship in each group. Each loop represents one cardiac cycle. MI, n = 10; hHVS, n = 10; hHVS + c-kit+, n = 10; sham, n = 7.

