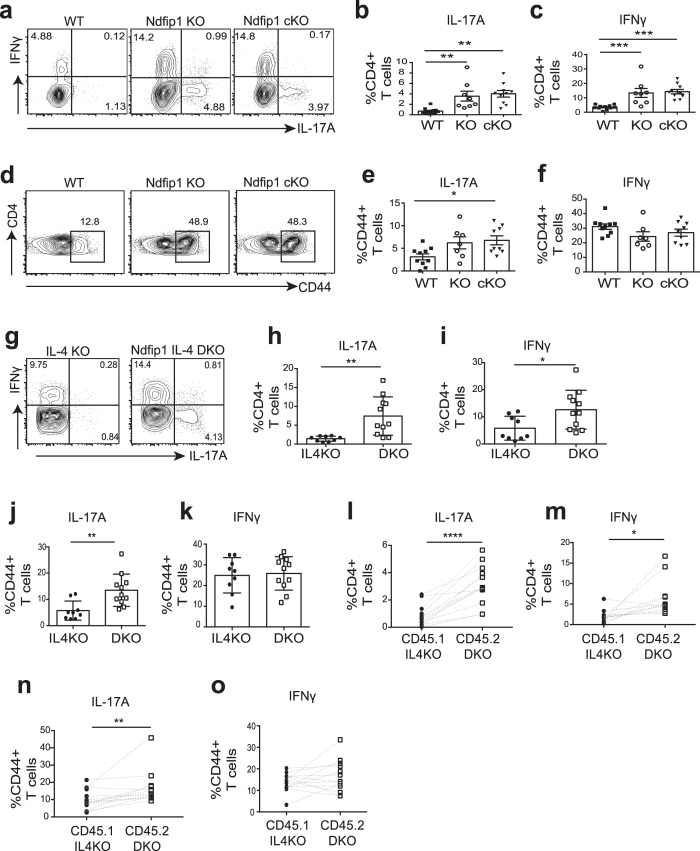
Figure 1. Ndfip1 limits the abundance of Th17 cells.
(a–f) Flow cytometric analysis of CD3+ CD4+ T cells among cells isolated from lungs of wild type (WT), Ndfip1 knockout (KO), or Ndfip1fl/fl CD4-Cre (cKO) animals, showing representative (a,d) or combined (b,c,e,f) data from multiple experiments. (a–c) Percentages of lung CD4+ T cells that are IL-17A+ (a,b) or IFNγ+ (a,c). (d) Percentages of previously activated (CD44+) CD4+ T cells in the lung. (e–f) Percentages of CD44+ CD4+ cells that are IL-17A+ (e) or IFNγ+ (f). (g–k) Flow cytometric analysis of CD3+ CD4+ T cells from lungs of Ndfip1−/− IL-4−/− (DKO) mice or IL-4−/− (IL-4KO) controls, showing representative (g) or combined (h–k) data from multiple experiments. (g–i) Percentages of lung IL-17A+ (g,h) or IFNγ+ (g,i) CD4+ T cells. (j,k) Percentages of previously activated cells (gated as in panel d) that produce IL-17A+ (j) or IFNγ+ (k). (l–o) Flow cytometric analysis of CD3+ CD4+ T cells from lungs of CD45.1 IL-4−/− (IL-4KO) and CD45.2 Ndfip1−/− IL-4−/− (DKO) mixed chimeras. (l,m) Percentages of lung IL-17A+ (l) or IFNγ+ (m) producing cells of CD45.2 DKO or CD45.1 IL-4KO origin. (n–o) Percentages of IL-17A+ (n) or IFNγ+ (o) producing cells among previously activated T cells of CD45.2 DKO or CD45.1 IL-4KO origin. In (a–f) n = 8–11 animals per genotype, analyzed at 7–9 weeks of age in 7 independent experiments using one-way ANOVA and Holm-Sidak’s multiple comparisons test. In (g–k) n = 9–11 animals per genotype analyzed at 6–16 weeks old in 4 independent experiments using an unpaired T test. In (l–o) n = 13 mixed chimera animals at 7–8 weeks old in 2 independent experiments using a paired T test. *p < 0.05, **p < 0.01, ***p < 0.001, ****p < 0.0001. All error bars represent mean +/− SEM.

