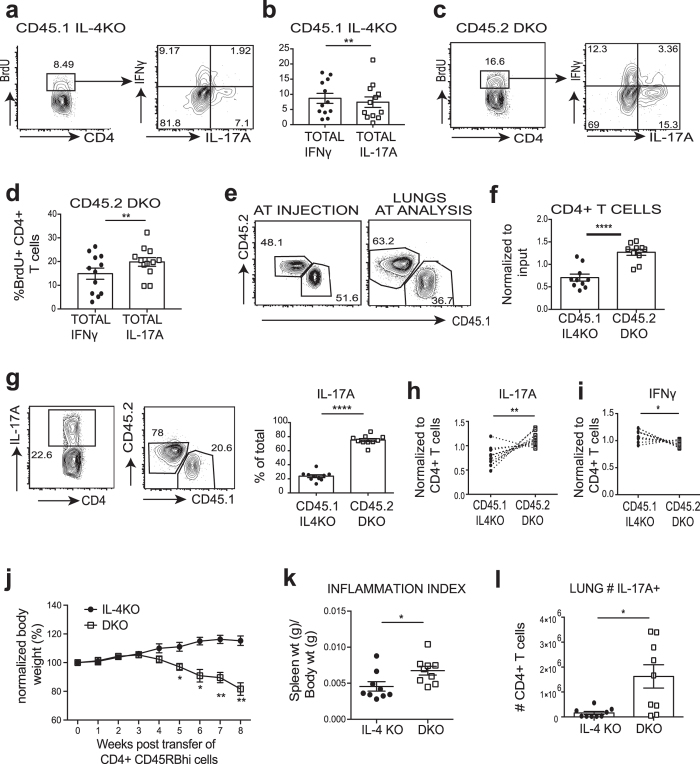
Figure 3. Ndfip1-deficient CD4 T cells outcompete control cells in vivo.
(a–f) CD45.2 Ndfip1 IL-4 DKO and CD45.1 IL-4KO bone marrow was injected into RAG1−/− animals and BrdU was administered 3 days prior to harvest. BrdU+ CD4+ cells in the lungs were examined by flow cytometry. (a) A representative plot showing the percentages of CD45.1 IL-4KO BrdU+ T cells in the lung as well as their production of IL-17A or IFNγ. (b) The percentages of IL-17A or IFNγ producing cells from multiple mice. Each dot represents a single mouse. (c,d) Same as in A and B but showing percentages for CD45.2 DKO BrdU+ cells in the lung. (e–j) 1:1 mixtures of naïve sorted, CD4+ T cells from Ndfip1 IL-4 DKO and IL-4KO were injected into RAG1−/− animals. After 7–8 weeks, cells were isolated from the lungs, stimulated with PMA/Ionomycin, and analyzed using flow cytometry. (e) Percentages of CD45.2 DKO versus CD45.1 IL-4KO CD4+ T cells in the injection mixture and in the lungs at analysis. (f) Ratio of frequencies of CD45.2+ versus CD45.1+ CD4+ T cells in the lungs at harvest, compared to the ratio in the input injection mixture. (g) A representative plot showing the total Th17 cells in the lungs and the frequencies of CD45.1 or CD45.2 among Th17 cells. (h) Normalized ratio of percentages of congenic Th17 cells relative to CD4+ cells bearing each congenic marker. (i) The same analysis as in panel h but focused on Th1 cells. (j–l) Sorted CD4+ CD45RBhi naïve T cells were injected into RAG−/− recipients. (j) Weight change relative to starting body weight. (k) Spleen weight normalized for body weight at harvest. (l) Total number of Th17 cells found in the lungs of recipients of IL-4KO or DKO T cells. In (a–d) n = 12 mixed chimera animals in 2 independent experiments. Statistical significance was calculated by paired two-tailed T tests. In (e–i) n = 11 animals in 2 independent experiments. Significance was calculated by paired T test. In (j–l) data is pooled for n = 10 IL-4KO animals and n = 9 DKO animals in 2 experiments, analysis by unpaired T test. *p < 0.05, **p < 0.01,****p < 0.0001. Error bars represent mean +/− SEM.

