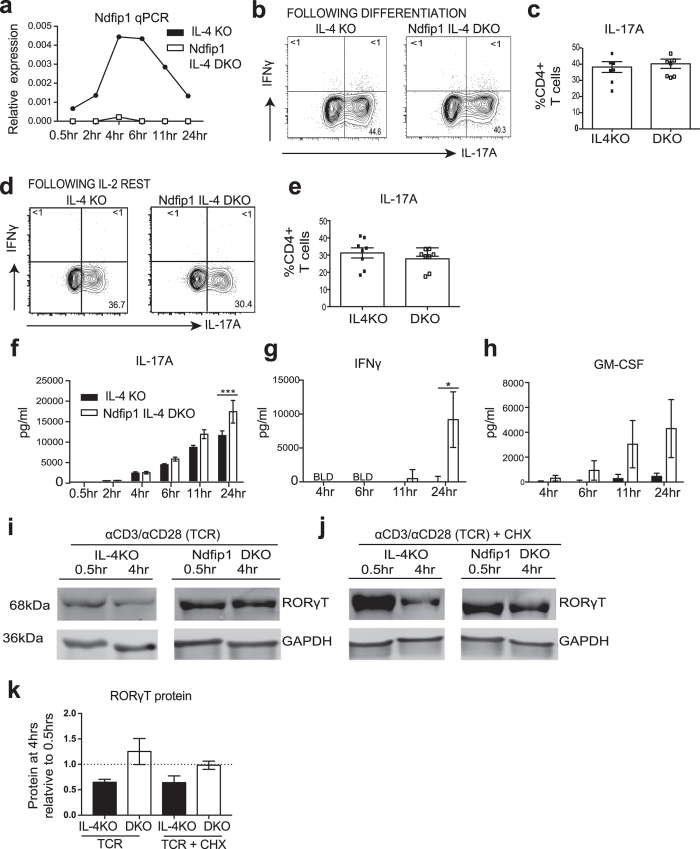
Figure 4. Ndfip1 limits proinflammatory cytokine production from Th17 cells upon restimulation and promotes RORγT degradation.
(a) Ndfip1 mRNA expression, relative to beta actin, in restimulated Th17 cells over multiple time points indicated. (b) Representative plot showing IL-17A+ and IFNγ+ cells after the initial 5 days of Th17 polarization. (c) Summary data for (b) over multiple experiments. (d) Representative plot showing IL-17A+ or IFNγ+ Th17 cells after IL-2 expansion of cells shown in panels b and c. (e) Summary of data over multiple experiments. (f–h) Cytokines were analyzed by ELISA following restimulation of the Th17 cells. (f) IL-17A (g) IFNγ and (h) GM-CSF. (i-k) Naïve CD4+ T cells were differentiated into Th17 cells and then restimulated with αCD3/CD28 (TCR) for 0.5 hrs or for 4 hrs in the absence (i) or presence (j) of cycloheximide (CHX). Lysates were analyzed for RORγT and GAPDH levels using western blot. (k) Quantification over multiple experiments of RORγT levels relative to GAPDH loading control. In (a–h) n = 8 per genotype analyzed in 4 independent experiments. Panel e is a summary of cells used in (f–h). Panels i-k represent data from n = 4 per genotype in 3 independent experiments. Significance was calculated by unpaired T tests for panels c and e and by 2-way ANOVA for panels f-h. *p < 0.05, ***p < 0.001. All error bars represent mean +/− SEM.

