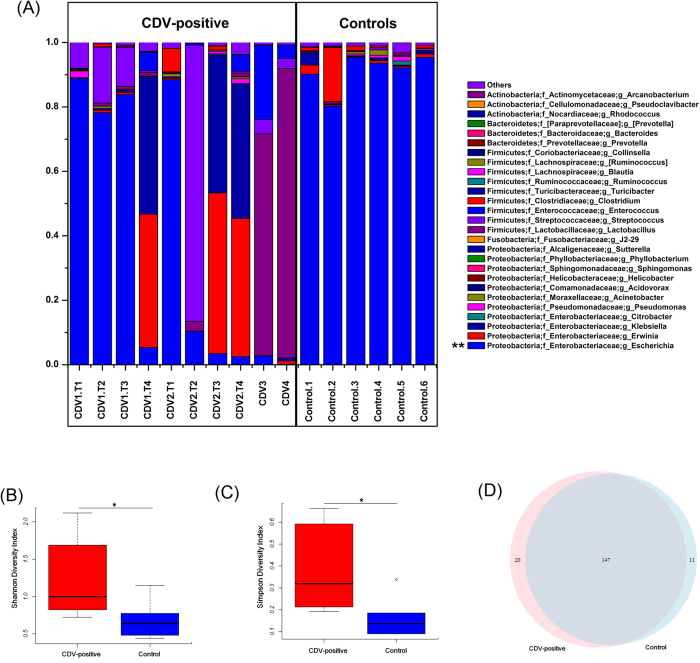
Figure 1. Comparison of the gut microbiota composition between CDV-infected individuals and healthy controls.
(A) Relative contribution of the top 20 dominant genera in each sample. Genera that differed significantly between the CDV-infected individuals and the healthy controls are marked with asterisks (P < 0.01 using one-way ANOVA). The Shannon (B) and Simpson (C) indices were used to estimate diversity (data shown as the mean ± SEM). A Venn diagram illustrating the overlap of OTUs in the gut microbiota between individuals with or without CDV infection (D).

