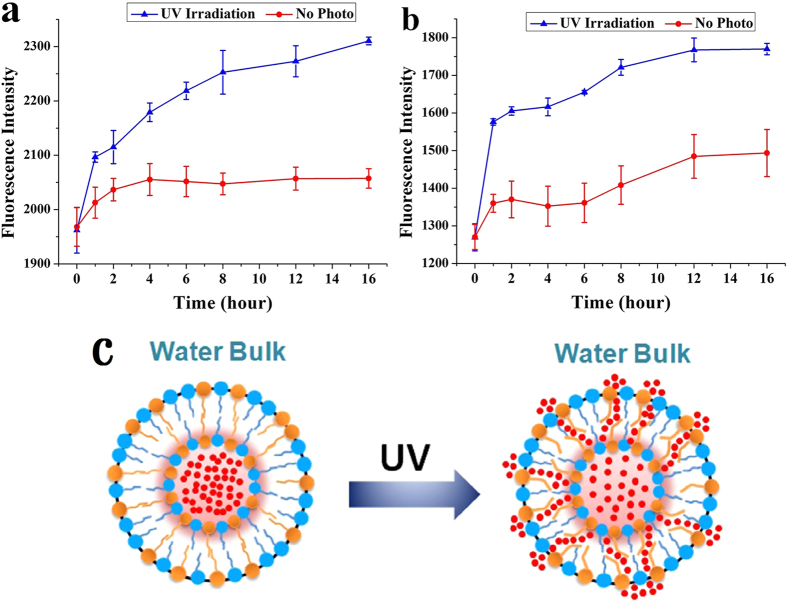
Figure 4.
Release profiles of rhodamine B (RhB) from CAB/SDS vesicles (a, CAB15; b, CAB30) as a function of time after periodic UV light irradiation for 10 min every hour in water, T = 25 °C. Each time point represents the mean ± SD (n = 3). (c) Schematic illustration of photocontrolled release of RhB from CAB/SDS vesicles.

