
Figure 3. Relative gene expression of bioinformatic selected miRs differentially expressed by qPCR analysis in HCT-116 and HT-29 colon cancer cell lines versus CCD-18Co normal colon cell line.
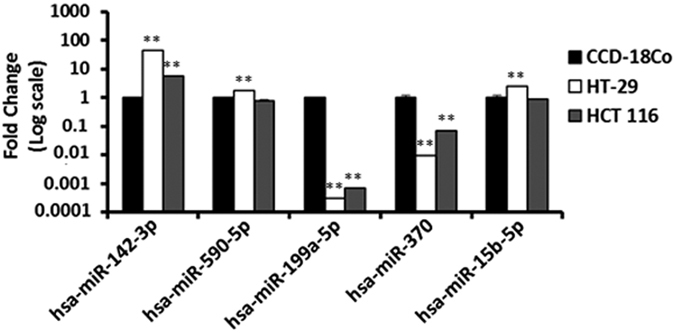
Values were normalized using the previously determined SNORD44 normalizer. Data are mean values ± SEM of three independent experiments. Significance was calculated using Student’s t-test. *p < 0.05; **p < 0.01.