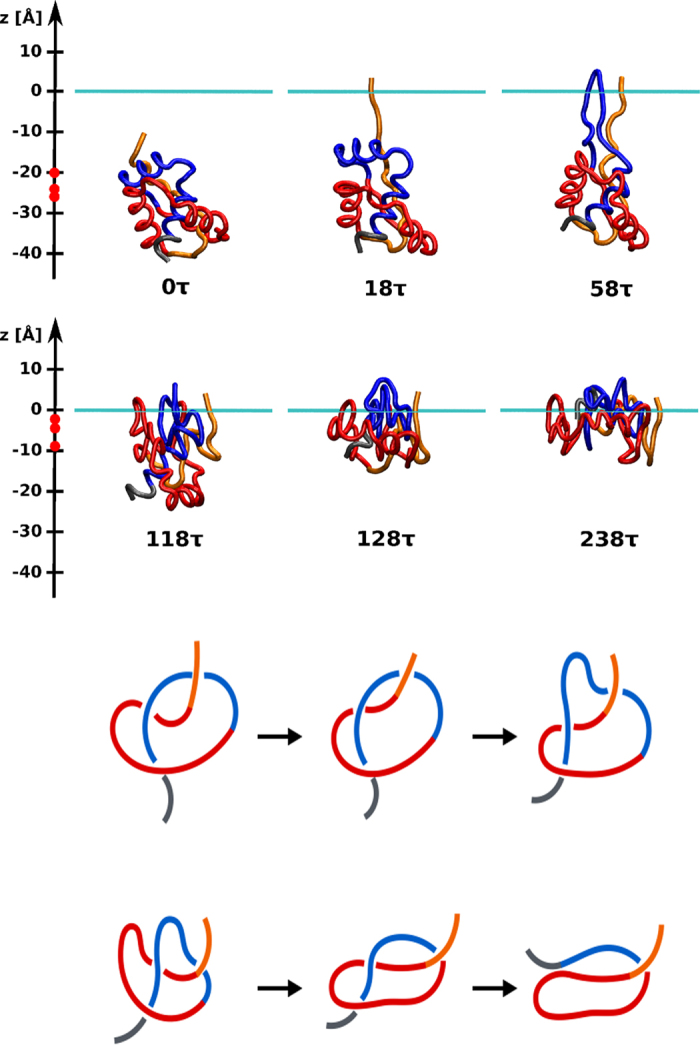
Figure 6. The interface-induced untying of the knot in 2EFV.

The 6 top panels show snapshots of the backbone conformations at times indicated. The horizontal line shows the level corresponding to the center of the interface. The first panel corresponds to the protein that is still away from the interface. The red marks on the z-xis indicate the subsequent positions of the center of mass of the protein. The 6 bottom panels show the schematic topological representations corresponding to the conformations shown in the top panels. Untying is accomplished through the DT mechanism.
