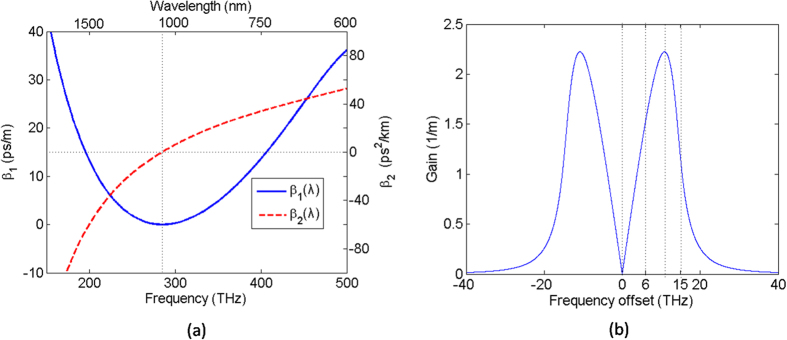
Figure 1.
(a) The group delay β1 = β′(ω) (blue solid curve) and the related group-velocity dispersion β2 = β″(ω) (red dash curve) as the function of the frequency and wavelength. The dotted line is located the zero dispersion wavelength at the 1055 nm. (b) MI gain spectrum (blue solid curve) for the pump power of 150 W as the function of seed frequency offset. The dotted lines are located at the frequency offset of 0 THz, 6 THz, 11.75 THz and 15 THz.

