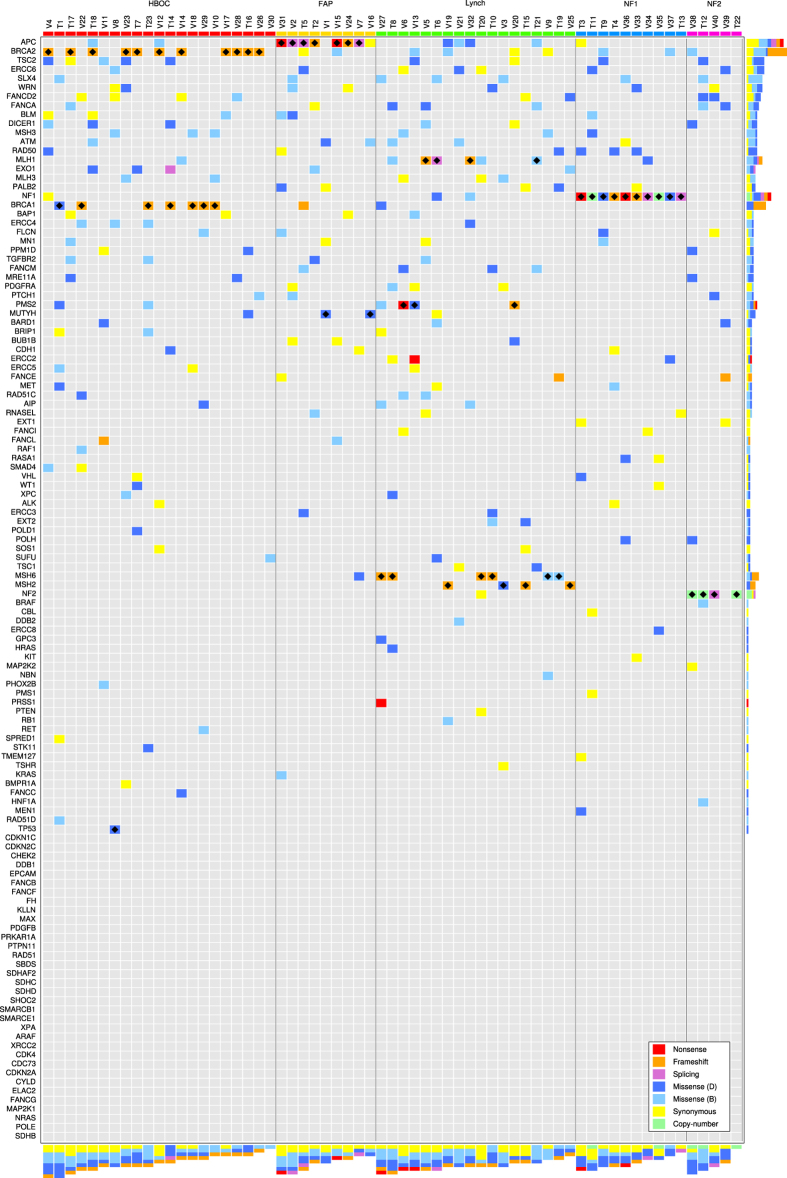
Figure 4. Variation landscape of hereditary cancer genes.
Matrix representation of the rare variants found in the training and validation samples. Only variants with a MAF below 1% in all populations from 1000 Genomes or ExAc projects are included. Each row represents a gene and each column a sample. Samples are ordered by clinical condition and by total number of variants. Genes are ordered by total number of variants without taking into account the disease-causing mutation. Each cell of the matrix is colored according to the type of variant found: red for nonsense, orange for frameshift, purple for splicing, blue for missense, yellow for synonymous and green for copy-number variants. If more than one variant was found in a given gene on a given sample, the color of the most damaging variant was used. Missense variants were further separated into two groups according to in-silico functional impact predictions using data from Polyphen2 HDIV and HVAR, SIFT, PROVEAN and MutationTaster. If more than 3 of the algorithms classified the variant as neutral, it was considered a neutral variant and colored in light blue; otherwise it was considered a possibly damaging variant and colored with dark blue. Bars on the right hand side represent the total number of variants per gene and their type. The bottom bars represent the total number of variants per sample. Finally, black diamonds denote the disease-causing mutations.

