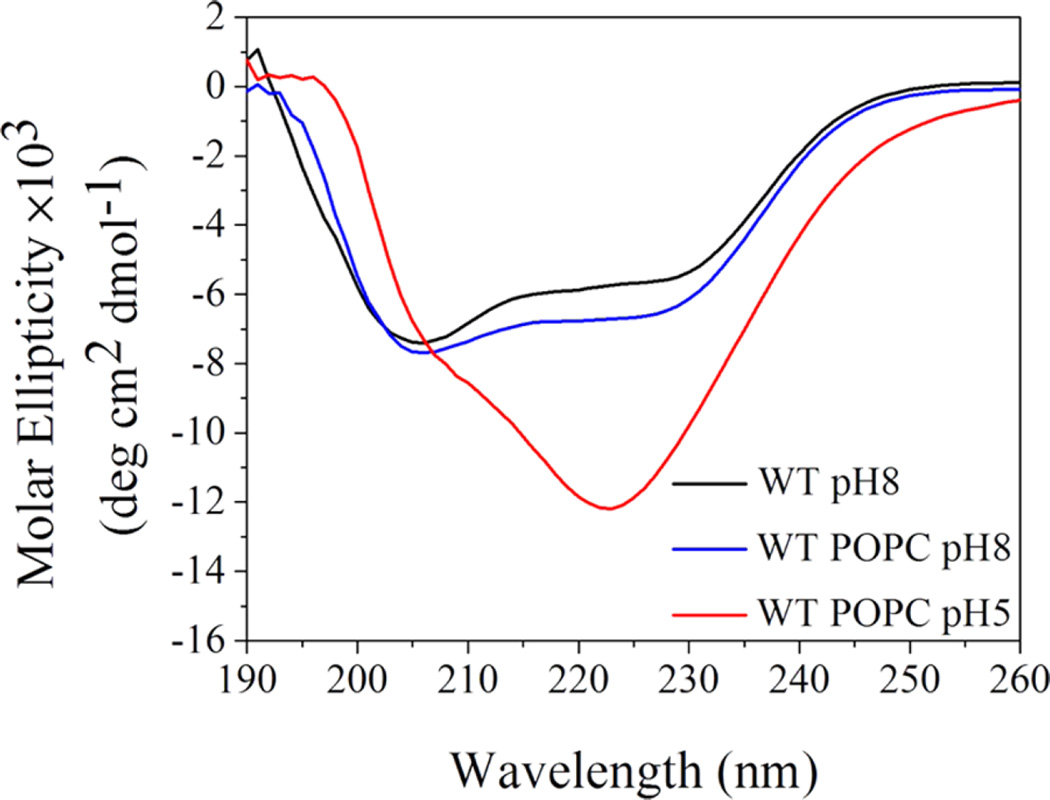
Figure 5.
Three states of the WT pHLIP peptide were monitored by changes in the CD signal. State I (black line) represents a peptide in solution at pH 8.0. State II (blue line) is a peptide in solution in the presence of POPC liposomes at pH 8.0. State III (red line) is a peptide in solution in the presence of POPC liposomes at pH 5.0.

