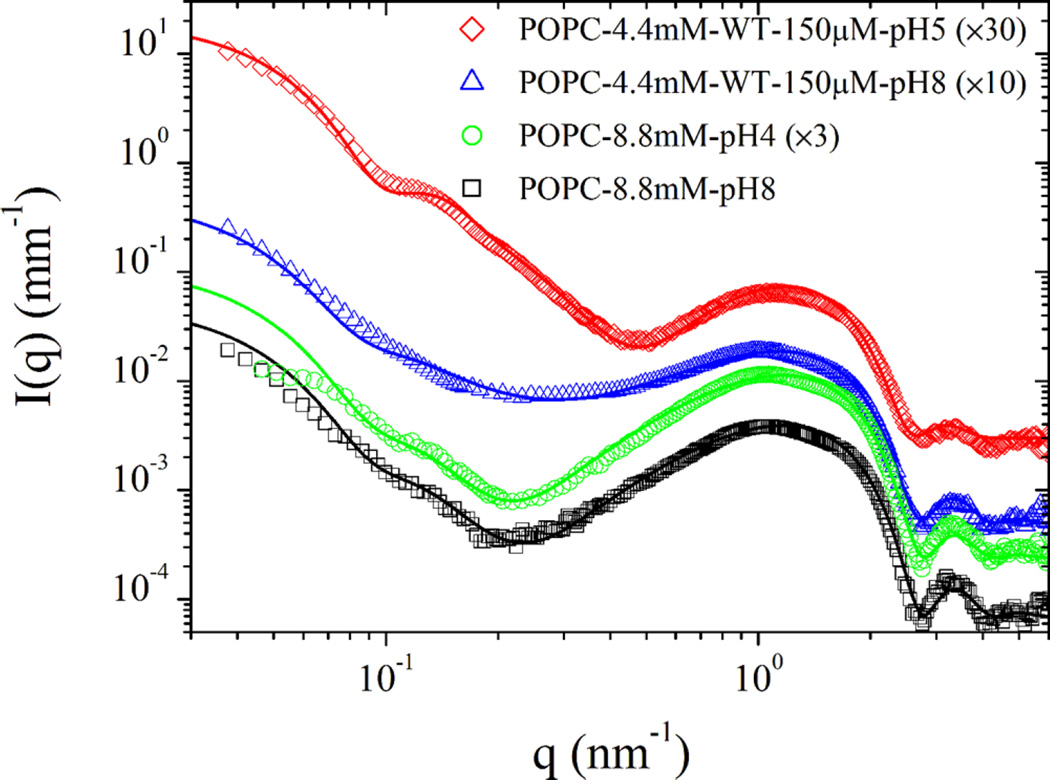
Figure 6.
SAXS intensities from the POPC liposomes of nominal diameter 50 nm without and with the WT pHLIP peptide. The low-q region shows the unilamellar vesicle features, whereas the high-q region depicts the prototypical bilayer form factor. Data were analyzed using the polydisperse unilamellar vesicle model with three Gaussian electron density profiles for the lipid bilayer using eqs 3 and 4. Main parameters of the model are tabulated in Table 2. For clarity, successive scattering curves have been multiplied by the factor indicated in parenthesis.

