
Fig. 3.
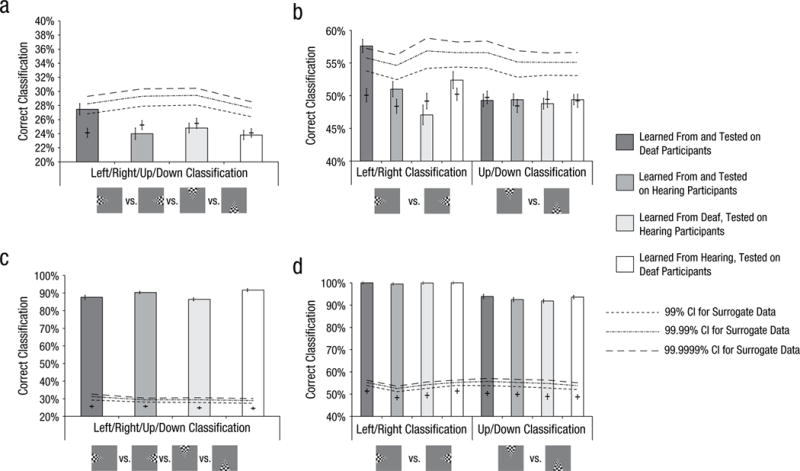
Classification accuracy for real data (bars) and surrogate data (lines) in bilateral auditory cortex (top row) and visual cortex (bottom row). Performance is shown for the contrast between the four quadrants in which the wedge stimuli appeared (a, c) and for the contrasts between left versus right and up versus down wedges (b, d). In each data bar, the error bar showing ±1 SEM for the real data is toward the left, and the error bar showing ±1 SEM for the surrogate data is in the center. The horizontal bar crossing the error bars for surrogate data shows the mean. Some of the error bars for the real data are too small to be easily visible here. CI = confidence interval.