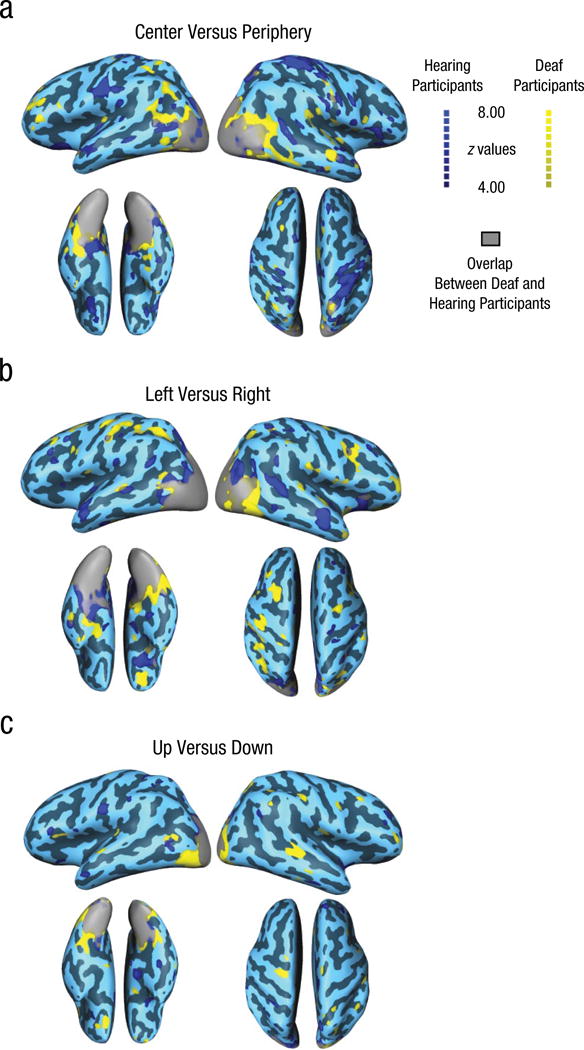
Fig. 4.

Results from the whole-brain searchlight analysis in deaf and hearing participants. Decoding performance effect maps (z values) are shown separately for the contrasts of (a) center versus periphery for annuli, (b) left versus right for wedges, and (c) up versus down for wedges. All z values shown (calculated against surrogate data) correspond to p values equal to or less than .0001.
