Fig. 2.

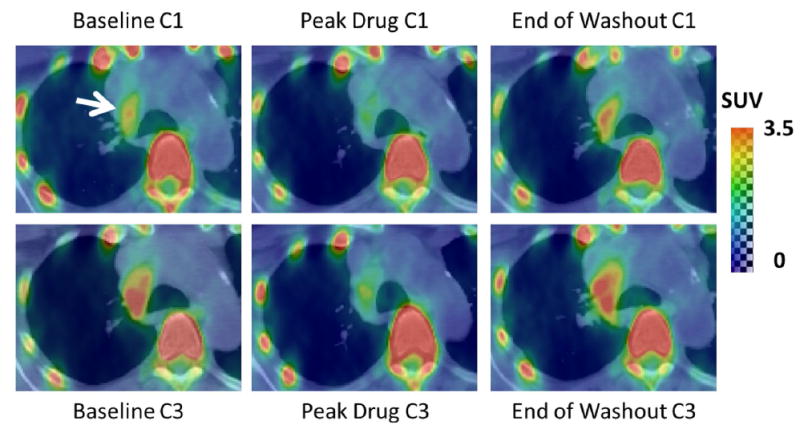
Axial PET/CT slice with increased SUV in right paratracheal lymph node (white arrow). Note reduced SUV at peak drug in both cycle 1 and cycle 3 which subsides by the end of washout. C1 cycle 1, C3 cycle 3

Axial PET/CT slice with increased SUV in right paratracheal lymph node (white arrow). Note reduced SUV at peak drug in both cycle 1 and cycle 3 which subsides by the end of washout. C1 cycle 1, C3 cycle 3