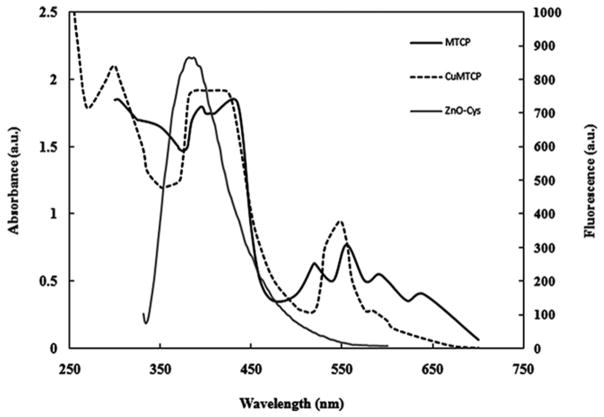
FIG. 3.
Comparison of fluorescence spectra of ZnO-Cys (scaled at the right-hand side of secondary axis) with the absorption spectra of MTCP and CuMTCP scaled at the left-hand side of the primary axis. The overlapped absorption spectra of MTCP or CuMTCP with the fluorescence spectrum of ZnO-Cys indicated the successful occurrence of the FRET. The a.u. denotes absorbance units (left axis) or arbitrary units (right axis).

