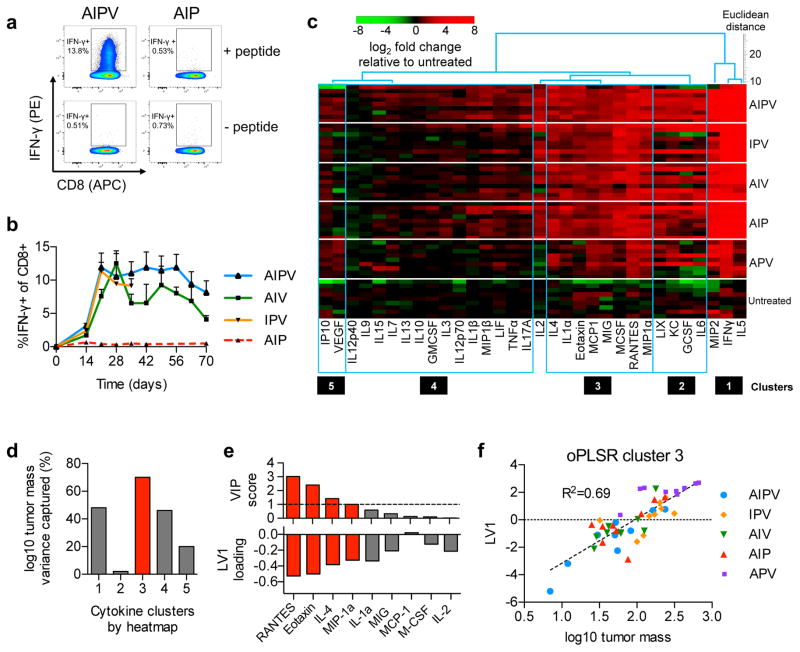
Figure 2. AIPV therapy primes sustained vaccine-specific T-cell responses and remodels the microenvironment of established tumors.
B16F10 tumors in C57Bl/6 mice were treated with AIPV or indicated ternary combinations of the therapy components as in Fig. 1a. a–b, Peripheral blood cells were stimulated with Trp2 peptide for 6 hours in the presence of brefeldin A and then analyzed by intracellular cytokine staining. (a) Representative intracellular cytokine staining to detect Trp2-specific CD8+ T-cells in peripheral blood on day 21. (b) Mean±s.e.m. percentage IFN-γ+ among CD8+ T-cells over indicated time points (n = 5/group, b). c–f, Mice bearing B16F10 tumors were treated with the regimens indicated on the right. Seventeen days later, tumors were isolated and cytokine and chemokine levels were measured by Luminex (n = 9/group). (c) Five co-regulated clusters of cytokines and chemokines were identified by hierarchical cluster analysis and then pruning clusters by applying a threshold to linkage distance (Supplementary Fig. 5). (d) These clusters were independently tested for their ability to predict log-transformed tumor size in treated mice on day 17 using a single latent variable (LV) in an orthogonalized partial least squares regression (oPLSR) model. (e) For the best performing cluster 3 (red bar), VIP scores (a measure of each cytokine’s contribution to the LV score and overall regression performance) were used to assess the contribution of individual proteins from the cluster to the oPLSR model; VIP scores >1 (dotted line) were considered significant (top, red bars) and the loading factors for LV1 of the oPLSR model are shown (bottom, red bars). (f) A scatter plot shows the oPLSR model performance for individual mice from all treatment groups and the best fit linear regression (dotted line) (f).

