
Fig. 3.
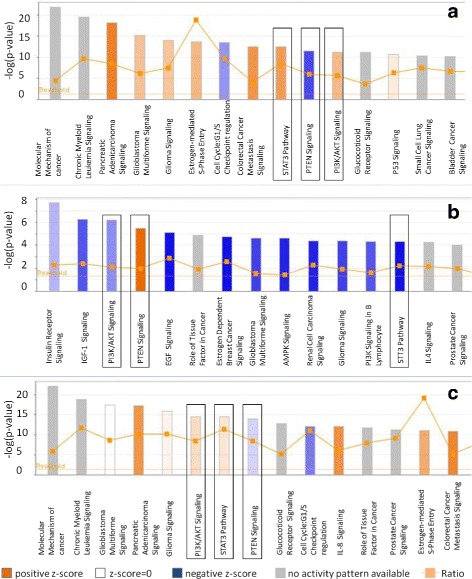
Canonical Pathway Chart of the (experimentally observed) genes targeted by 20 differentially expressed miRNA that found correspondence with human miRNA. Pathways analyses were calculated from: a) miRNAs up-regulated in the High Motile (HM) fraction; b) miRNAs up-regulated in the Low Motile (LM) fraction and c) Total of miRNAs differentially expressed between the (HM) and (LM) fractions. In squares, pathways that showed a positive or negative score and were shared between miRNAs up-regulated in the HM and LM fractions. The first 15 pathways are shown in the figure