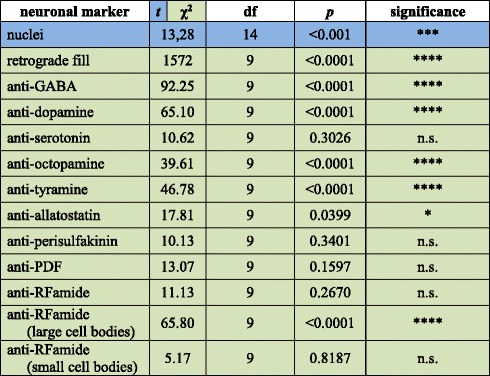
Table 1.
Results from Student’s t-test and χ2-tests for significant differences in the distribution of stained somata for each marker in Euperipatoides rowelli

The statistical significance for the Student’s t-test (blue) indicates that the deviation from the mean of stained somata within 20 μm thick sections of the leg-bearing region (seven sections) differs significantly (***, p < 0.001) from the deviation of the mean of stained somata within the interpedal region (nine sections). The statistical significance for the χ2-test (green; *, **, ***, ****, p < 0.05, 0.01, 0.001, 0.0001, respectively) indicates that the distribution of stained somata within the ten portions of one hemisegment differs significantly from a theoretically expected uniform distribution with no regional specialisation in the nerve cord. df, degrees of freedom for the test; n.s. not significant; p, probability of error
