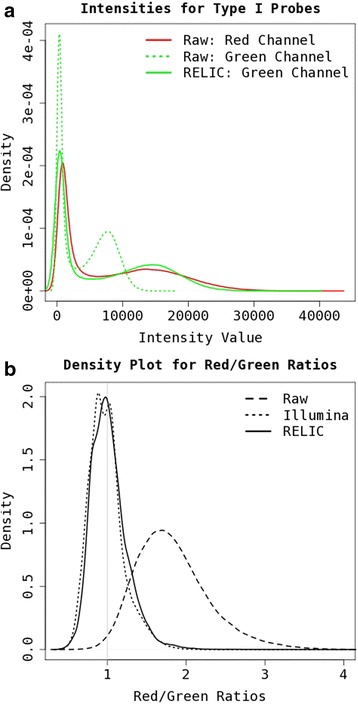
Fig. 1.

Demonstration of dye-bias correction effects with a) Intensity value distributions for Infinium I probes on red and green channels before and after adjustment with RELIC method for a typical sample; b) Distribution density plot for red/green ratios in normalization control probes for 889 blood samples before and after adjustment with RELIC or the Illumina method
