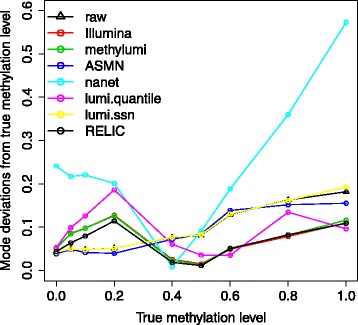
Fig. 2.

Effect of various dye-bias correction methods on methylation accuracy in Dataset 1, in which nine different methylation levels (0, 5, 10, 20, 40, 50, 60, 80 and 100%) were created by mixing unmethylated and fully methylated DNA together in different proportions. Shown are averaged absolute deviations of the beta value (adjusted using different methods) distribution mode from expected methylation level
