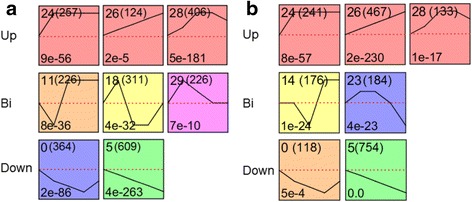
Fig. 4.

Significantly enriched profiles (P value ≤ 0.05) during fruit ripening as revealed by time-course analysis. Profiles in COS (a) and LSW177 (b). The profiles were classified into three groups, Up (upregulated), Bi (biphasic expression pattern), and Down (downregulated), and further ordered based on their profile number following the number of genes in the bracket (top left-hand corner). The P value assigned to each profile is shown in the bottom left-hand corner. Significantly different profiles are represented by different background colors
