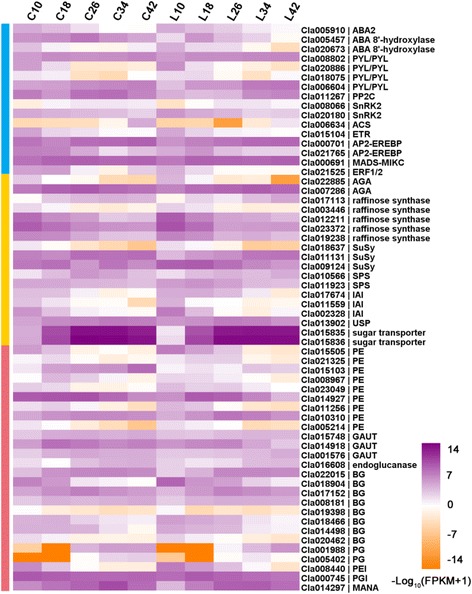
Fig. 8.

Heat map diagram of the expression levels of DEGs. Gene expression data were normalized to log10. The DEGs are involved in plant hormone biosynthesis and signaling transduction (blue), sugar metabolism (red), and cell wall metabolism (green)

Heat map diagram of the expression levels of DEGs. Gene expression data were normalized to log10. The DEGs are involved in plant hormone biosynthesis and signaling transduction (blue), sugar metabolism (red), and cell wall metabolism (green)