
Fig. 4.
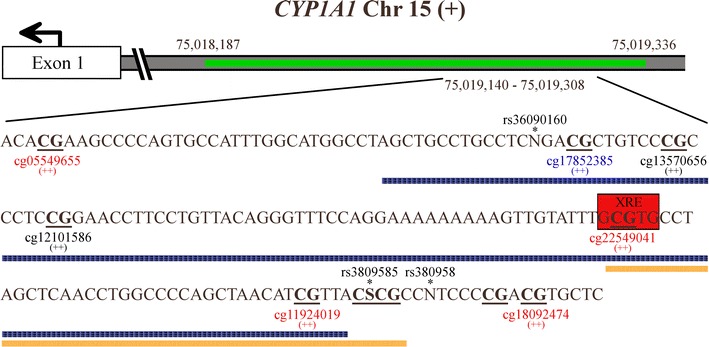
CpG sites located on the shore of a CpG island in a bidirectional regulatory region of the CYP1A1 gene. The CpG island is depicted in green with a distinct portion magnified (chr15:75,019,140-75,019,308). CpG sites are denoted in bold and underlined whereas possible SNPs are indicated with an asterisk. The orange bar represents the analyzed sequence in our study and includes four CpG sites. The blue bar represents the analyzed sequence in placental tissue derived from the article of Suter et al. [19] and includes five CpG sites. The cg probes that were investigated in the 450 K study of Joubert et al. [23] in cord blood are displayed with the color representing the statistical significance of the association between plasma cotinine and methylation of the probe (blue p > 1 × 10⁻⁵; black 1 × 10⁻⁵ ≥ p ≥ 1 × 10⁻⁷; red p < 1 × 10⁻⁷) and the magnitude of effect (++: higher methylation). The information on the figure is based on the UCSC Genome Browser on Human Feb. 2009, GRCh37/hg19